
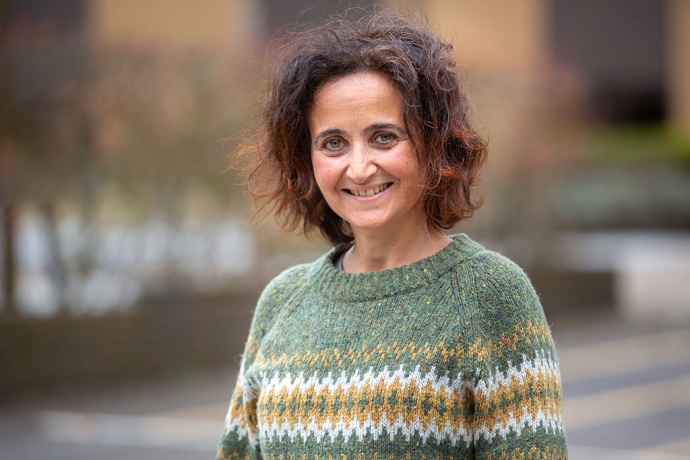
This year’s Annual Seminar is dedicated to a key product from the EU-funded Copernicus Climate Change Service (C3S) implemented by ECMWF: the reanalysis of past weather and climate. One of the speakers is Chiara Cagnazzo, who supports C3S users from different economic sectors.
Chiara’s first brush with atmospheric science came during her time as a physics student in Rome, when she had the choice between specialising in astrophysics and geophysics. “I opted for the latter, and followed it up with a PhD in Paris in atmospheric dynamics,” she says.
As part of a PostDoc in Italy, she moved to climate modelling: running and writing parts of climate models and realising climate simulations. These were then included in different reports by the Intergovernmental Panel on Climate Change (IPCC).
During a time at the National Research Council of Italy, Chiara studied long-term climate change, the connection between stratospheric dynamics and the tropospheric climate, and climate predictability at different spatial and temporal scales.
She joined ECMWF in 2020 to lead a team that supports C3S users in sectors of the economy that are sensitive to climate variability and climate change.
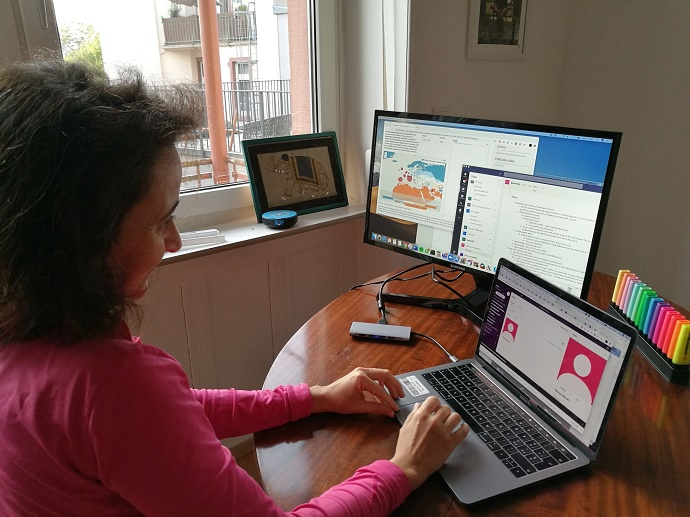
Chiara became immediately active at ECMWF, here during the #EUvsVirus Hackathon held remotely during a period of social distancing in April 2020. The hackathon supported research into the connections between environmental conditions and the spread and effects of COVID-19.
Use of climate data
Chiara’s task at C3S is to develop applications, workflows and methodologies built on climate data to support users in sectors that could benefit from such data. This includes a wide range of economic activity, for example in the energy, water, agriculture, insurance and health sectors.
“In practice, we build methods, data and applications tailored to users in those sectors, on top of C3S climate information,” she says.
The starting point is key C3S data, such as a range of observations from satellites and other sources, the ERA5 reanalysis, seasonal forecasts and climate projections.
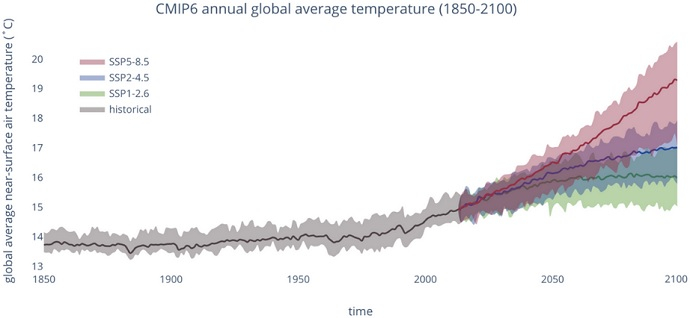
These climate projection scenarios are based on CMIP6 data available in the C3S Climate Data Store (CDS). They show global mean temperature between 1850 and 2100 for selected CMIP6 models. The grey shaded area shows the range of historical simulations and the coloured areas show potential future temperature change based on different greenhouse gas emission scenarios (red is pessimistic, blue is realistic and green is optimistic). Credit: Copernicus Climate Change Service, ECMWF.
Energy and water
Renewable energy is an example where C3S can make a difference. “There is an increasing share of renewable sources in the energy mix, so we have built an operational ‘energy service’ for different categories of users.”
This includes users that need to assess the climate impact on energy production, such as wind farm operators, and users that need climate information for their energy assessment studies, such as transmission system operators. “In practice, the energy service links climate data to energy variables in a quality-controlled and consistent manner,” Chiara says.
To achieve this, she needs to connect the present with the near and more distant future to make climate data directly useable. “We also bring users into contact with relevant experts beyond C3S because their expertise can be helpful.”
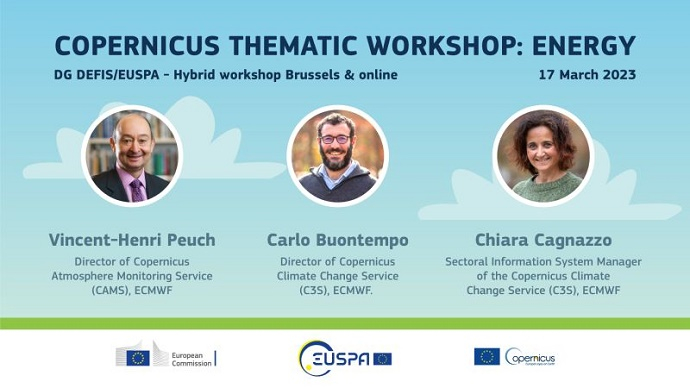
As part of her activities, Chiara takes part in relevant workshops.
Another example is the water sector, where C3S has set up an operational service to deliver seasonal forecasts with hydrological models. “This is done in collaboration with experts across Europe,” Chiara explains.
Focus on reanalysis
In the Annual Seminar, Chiara will give a presentation on how climate and weather reanalysis can be used in different applications.
She will explain who the main users of reanalysis are, how they use it, and what their requirements are.
“The reanalysis datasets are among the most used C3S data,” Chiara says. “For example, there are more than 100,000 users of the ERA5 reanalysis.”
She points out that reanalysis is used not just by the scientific community but by many other people. “This is also the result of significant advances in reanalysis products over the last few years and decades.”
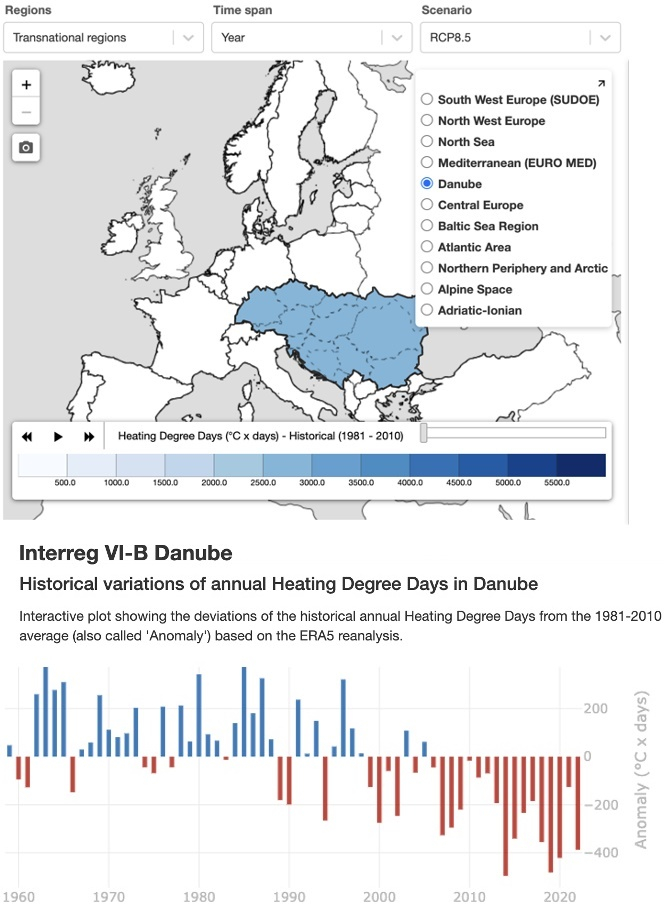
The value of the Heating Degree Days indicator estimate from the ERA5 reanalysis, aggregated across one transnational region (the Danube) as defined by the European Environment Agency. This is an index used to derive energy demand during winter. It measures how far the outdoor temperature is from a given indoor comfort temperature. The figure shows a long-term decrease of the index in the selected area, due to warmer winters.
The Annual Seminar
The programme of the Annual Seminar is accessible on the ECMWF website. Recordings of all talks, including Chiara’s, will be made available after the event.
