Tropical circulation is an important component of weather and climate models. Tropical features of organised convection, such as the Madden–Julian Oscillation (MJO) and the El Niño–Southern Oscillation (ENSO), are believed to have a strong impact on extra-tropical circulation and are critical for extended-range predictions. Waves in tropical circulation can be excited by disturbances caused by organised convection, and these tropical waves can propagate far from their sources and spread the impact of the convection.
Error properties in forecasts of tropical circulation are more difficult to establish than in the extra-tropics, where the geopotential height often provides sufficient information about the large-scale circulation. This is a consequence of a strong coupling between the geopotential height and winds in the extra-tropics, known as quasi-geostrophic balance. In the tropics, such balance is often weak and, therefore, the flow has to be decomposed into a balanced component, which is represented by the equatorial Rossby waves, and an unbalanced component that consists of inertio-gravity (IG) waves of many scales. Such a 'modal decomposition' can provide a deeper understanding of the circulation in the tropics, and of the sources of deficiencies in analyses and forecasts.
The recently developed MODES tool provides such a decomposition into balanced (Rossby) and unbalanced (IG) modes. It has been applied to analyses and forecasts produced by ECMWF’s Integrated Forecasting System (IFS) to discuss the scale-dependent energy content of Rossby and IG waves in the IFS and to analyse model performance in the tropics. Key findings include that IG modes make up a significant part of tropical circulation and are associated with significant analysis uncertainties and forecast errors.
Modelling tropical circulation
The representation of tropical circulation has significantly improved in most numerical weather prediction (NWP) systems over the last two decades (e.g. Bechtold et al., 2008). However, it remains one of the biggest challenges for data assimilation in global NWP. This can be illustrated by the results of a comparison between six state-of-the-art NWP systems by Park et al. (2008), who showed that the root-mean-square differences between the six analyses over the tropics exceeded the climatological standard deviation of the tropical circulation. The differences among the same analyses over the extra-tropics only amounted to about 10% of the corresponding climatological variability. Significant discrepancies between NWP analyses and reanalyses in the tropics are associated with a lack of direct observations of wind profiles and with complex tropical dynamics. The latter is also a reason why multivariate data assimilation, which can successfully analyse mid-latitude weather systems by using satellite observations of radiances, is less successful in constraining tropical circulation. Mid-latitude flow is close to quasi-geostrophic balance, meaning that there is a strong coupling, at a single horizontal level, between temperature or geopotential height on the one hand and winds on the other. Such coupling is on average weak in the tropics. The most important dynamical processes in the tropics occur in relation to convection, which generates a spectrum of inertio-gravity (IG) waves.
Rossby and IG waves are obtained as eigensolutions of the linearised primitive equations and they represent balanced (primarily rotational) and unbalanced (predominantly divergent) dynamics. Similar to the role of Rossby modes in the quasi-geostrophic theory for the mid-latitudes, IG modes are important for our understanding of tropical flow features. In particular, IG waves, which are characterised by small phase speeds and are equatorially trapped, have been used to describe tropical variability on all scales in both the atmosphere and oceans. An example is the Kelvin wave, the most studied IG mode of the global atmosphere, which is believed to play a significant role in the MJO and other low-frequency features in the tropics. In spite of the large amount of research and improved understanding of the role of IG oscillations on many scales, their representation is still a source of significant uncertainties in both weather and climate models.
Analysis uncertainties in the tropics are in part associated with (a lack of) modelling of the role of large-scale equatorially trapped IG waves in data assimilation. This was demonstrated by Žagar et al. (2005), who showed that the apparent decoupling between the tropical mass field and the wind field in the variational assimilation is a consequence of the combination of the equatorial Rossby and IG mass-wind couplings between wind and temperature fields that have different signs. For example, the Kelvin mode is characterised by a positive coupling between the zonal wind and geopotential height at the equator. As a result, it reduces the negative coupling between the mass and the zonal wind that is imposed by the quasi-geostrophic type of balance at the equator (Žagar et al. 2005). This illustrates an important effect that IG modes may have in ensemble data assimilation.
Diagnosing a model’s representation of divergence-dominated IG (unbalanced) circulation, and in particular of equatorial waves, can provide a better understanding of model deficiencies and new ideas for their improvement. This is the motivation behind MODES, a European Research Council-funded project at the University of Ljubljana that provides a tool for the quantification of the impact of unbalanced circulation in global NWP and climate models. The MODES software has been applied to ECMWF’s analyses and high-resolution forecasts (HRES) on a daily basis since the autumn of 2014. This article presents the evaluation of large-scale tropical circulation in January and July 2015 in ECMWF forecasts. This is supplemented by a decomposition of HRES mean analysis increments in the autumn of 2015.
The MODES software
MODES decomposes the global circulation into three-dimensional harmonic functions, more precisely into three-dimensionally orthogonal normal mode functions (NMFs) in the vertical sigma coordinate, which is naturally suited to the representation of atmospheric data. The 3D NMFs represent surface pressure, temperature and wind fields simultaneously. The method relies on a representation of the global baroclinic atmosphere in terms of M global shallow-water systems, each characterised by its own fluid depth for horizontal flow, known as the equivalent depth.
The projection procedure consists of a vertical projection followed by the horizontal step. The basis functions for the horizontal projection are the Hough harmonics. For every given vertical mode, the Hough harmonics are characterised by the zonal wavenumber and meridional mode. Details of the NMF representation are given in Žagar et al. (2015a), including a summary of the theory of normal-mode function expansion, instructions for the application of the MODES software, and outputs of its application to the ERA-Interim reanalysis dataset. Recently available software provides outputs also in NetCDF format.
The outputs of the modal decomposition are the complex Hough expansion coefficients, given as a function of vertical mode (m), meridional mode (n) and the zonal wavenumber (k). For every meridional mode, there are three solutions: a balanced mode, which obeys the dispersion relationship for Rossby waves, an eastward-propagating inertia-gravity mode and a westward-propagating inertia-gravity mode, denoted EIG and WIG, respectively.
MODES is funded by the European Research Council under the European Union's Seventh Framework Programme (FP/2007-2013)/ERC Grant Agreement no. 280153. The MODES tool and archived results are available from http://meteo.fmf.uni-lj.si/MODES. The MODES software relies on theoretical developments by Dr Akira Kasahara in the 1970s and 1980s at the National Center for Atmospheric Research in Boulder, CO, USA.
Decomposition of global circulation
The MODES software decomposes global dynamical fields into balanced and unbalanced (eastward- and westward-propagating IG) flow at different vertical and horizontal scales. This is achieved by representing the fields as a sum of oscillations, called Hough harmonics, with different vertical modes, meridional modes and zonal wavenumbers. The method is described in greater detail in Box A.
Since October 2014, ECMWF's operational 10-day forecast has been analysed using this method with a time step of 12 hours. The data from the 00 UTC run is analysed on 137 model levels and a reduced horizontal resolution provided by the regular Gaussian grid N128 (512×256 points in the zonal and meridional directions, respectively). However, not all vertical modes are included as the numerical solution of the vertical structure equation limits the usefulness of vertical modes with high vertical mode index. This results in an incomplete representation of the mass field in the lower troposphere (for details see Žagar et al., 2015a).
Energy distribution
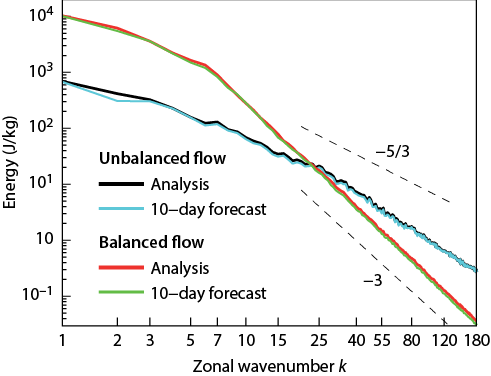
One of the MODES outputs is the distribution of total atmospheric energy in balanced and unbalanced components as a function of zonal wavenumber. Figure 1 shows the January 2015 average energy distribution for 00 UTC analyses and the corresponding 10-day forecasts. The energy spectra are shown up to the zonal wavenumber 180, which corresponds to a grid spacing of about 120 km at the equator and about 80 km in the mid-latitudes. As the spectral energy distribution presented in Figure 1 is different from commonly used energy spectra in the IFS, it may be useful to discuss the differences.
The basis functions used to produce Figure 1 are the Hough harmonics, whereas global spectral models such as the IFS use spherical harmonics. The latter are the eigensolution of the global barotropic vorticity equation whereas the former are the eigensolution of the global linearised shallow-water equations. A scale-dependent distribution of atmospheric energy is readily produced from both types of harmonic representation with an important difference: the spherical harmonics provide a kinetic energy spectrum at a given horizontal level as a function of the zonal or global wavenumber, whereas the Hough harmonics provide the spectrum of kinetic and available potential energy of horizontal motions associated with a prescribed equivalent depth (i.e. with a certain vertical mode) as a function of the zonal wavenumber and meridional mode. In other words, the spectra in Figure 1 include available potential energy and the whole model depth.
Furthermore, the application of spherical harmonics allows the decomposition of kinetic energy into rotational and divergent components, whereas the Hough harmonics provide an energy decomposition into balanced (or vorticity-dominated Rossby) and unbalanced (or IG, mainly divergent) components. The divergent energy spectra are often regarded as synonymous with IG spectra in mid-latitude mesoscale conditions. On large scales and in the tropics, such an assumption is not valid. For example, the equatorial Kelvin wave is a half-rotational and half-divergent mode and as such difficult to extract from IFS data.
Figure 1 shows that the energy spectrum for balanced flow follows the so-called 'minus 3 law' (the energy is proportional to the wavenumber k to the power of −3) all the way from the synoptic scales down to the smallest presented scale (5 < k ≤ 180). The energy spectrum for unbalanced flow is characterised by a flatter slope than for balanced flow, especially on subsynoptic scales (k > 15). In this scale range, the spectrum for unbalanced flow fits the −5/3 law well, in agreement with recent studies of the role of IG motions. The energy distribution at planetary scales (k < 5) shown in Figure 1 is a particularly useful diagnostic produced by the MODES tool as it corresponds to the sum of kinetic and potential energy computed from the wind components and geopotential height at these scales. By contrast, the computation of rotational and divergent energy for the wavenumber k from spherical harmonics involves derivatives and thus depends on velocities in neighbouring wavenumbers.
On subsynoptic scales (k > 15), the energy contribution from unbalanced flow dominates. Unbalanced circulation contributes between 5% and 10% of the total wave energy depending on the forecasting model and the season (Žagar et al., 2015a). For example, the planetary scales were significantly more energetic in January than in July 2015 (not shown). Figure 1 also includes the average spectra of 10-day HRES forecasts in January 2015. Comparing these with the analyses suggests that HRES tended to somewhat underpredict the variability at most scales, especially at zonal wavenumber 2.
Unbalanced circulation and Kelvin waves
The modal decomposition can be used to filter any mode and spatial scale back to physical space. For example, Figure 2 presents balanced and unbalanced flow in January and July 2015 for a level at the tropical tropopause. In January, the most significant geopotential height perturbation was present over the eastern Pacific, and it resembles the most energetic balanced mode: the Rossby wave with the lowest meridional mode (known as the n = 1 Rossby mode). In this region, the unbalanced winds were of the same direction, whereas over the central Pacific they were stronger and with the opposite sign compared to the balanced flow (Figure 2b,c). In July, the unbalanced winds were strongest over the Indian Ocean region in relation to the summer monsoon. Overall, Figure 2 shows that a significant component of large-scale tropical circulation is unbalanced in both months. In the lower tropical troposphere, unbalanced winds tend to be stronger than balanced winds, especially in the cross-equatorial component (not shown). On average, balanced and unbalanced flow are in opposite directions in the lower and upper troposphere near the equator, in agreement with simplified models of tropical circulation (Žagar et al., 2015a).
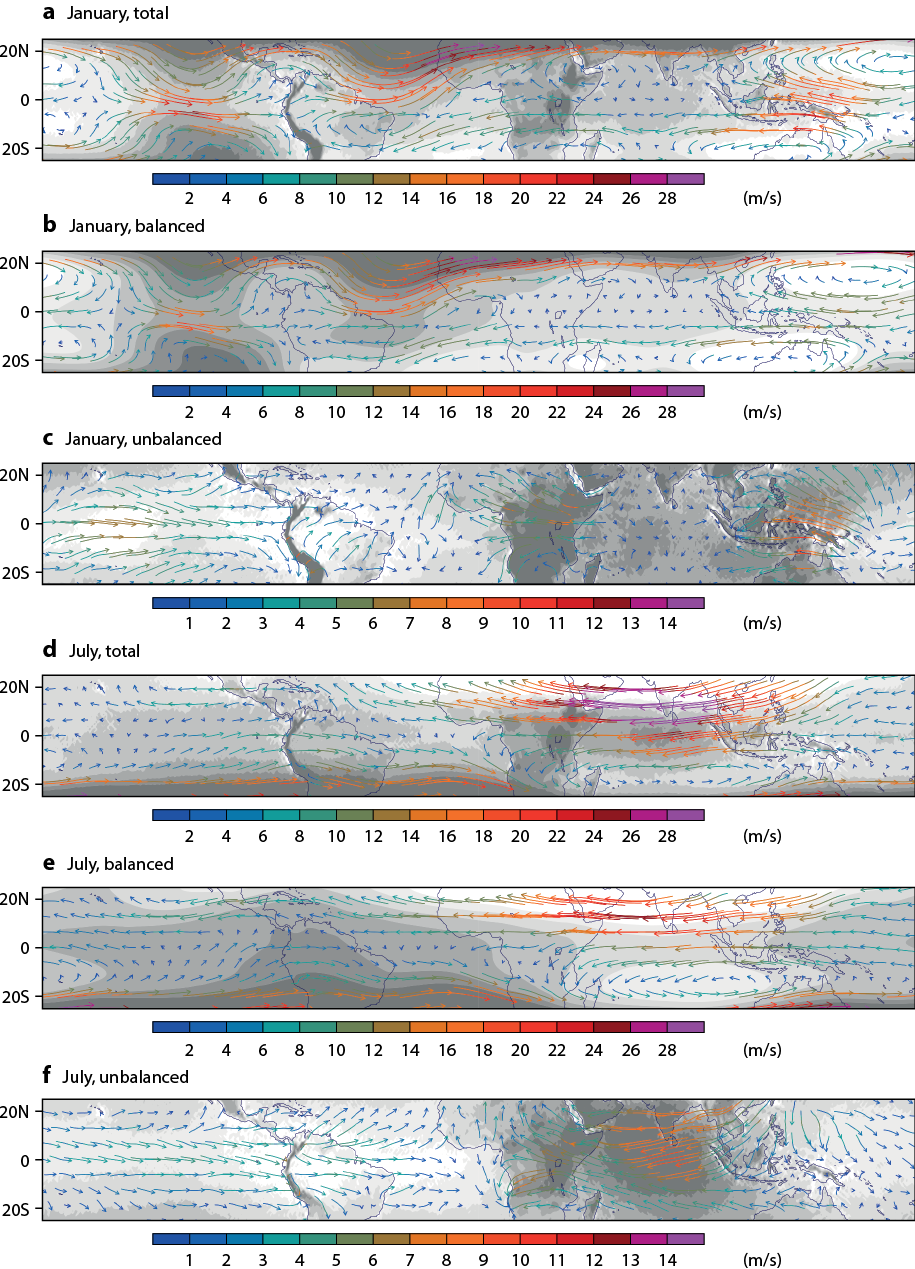
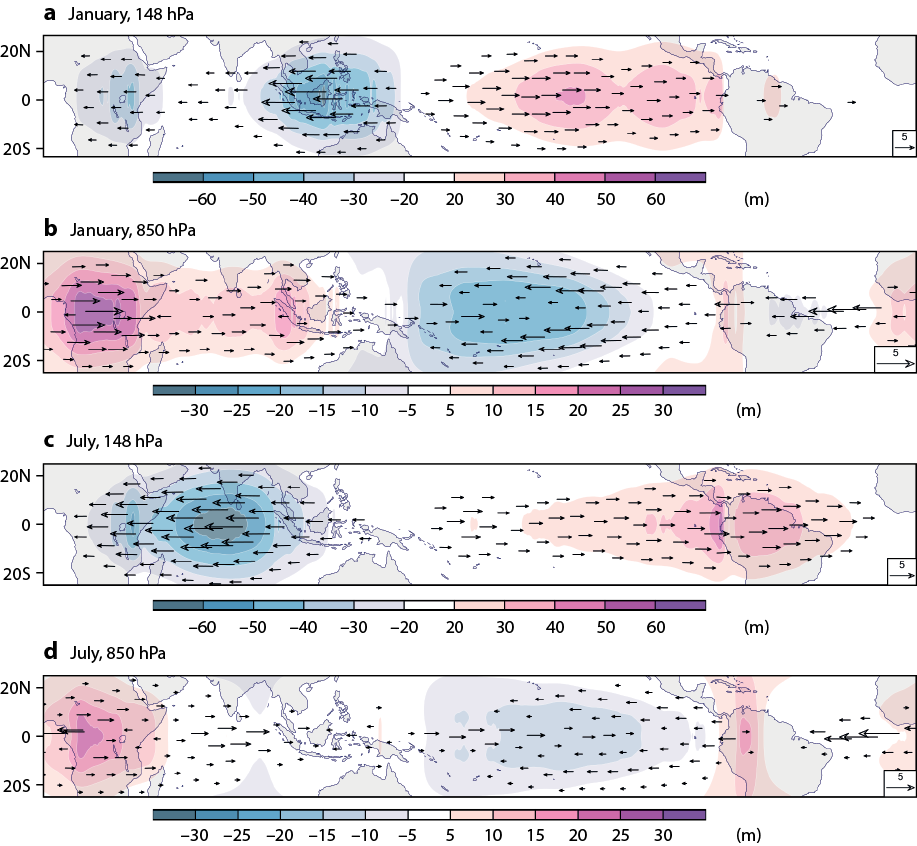
Figure 3 shows that, on average, the equatorial Kelvin wave signal is dominated by the zonal wavenumber 1 and has the largest amplitude over the Indian ocean in July. The propagation of Kelvin waves in the model forecasts is illustrated in Figure 4. Here, we put together results of the modal decomposition every 12 hours and show both zonal wind and temperature perturbations, computed from geopotential perturbations using the hydrostatic relationship. Although the decomposition is performed independently for each time step, when the outputs for successive times are put together, they naturally connect and show propagation properties known from linear theory and studies based on frequency filtering. This is a strong justification for the assumptions made for the derivation of normal modes used for the decomposition. Figure 4 shows how wind and temperature perturbations associated with the zonal wavenumber 1 Kelvin wave propagate in the equatorial stratosphere at a speed of around 60 m/s. It should be noted that the presented wave properties are the result of a summation over 70 vertical modes. The maximum energy in this case is found around vertical mode 8, which corresponds to an equivalent depth of around 450 metres, implying a shallow-water phase speed of around 65 m/s.
Evaluation of tropical forecast errors
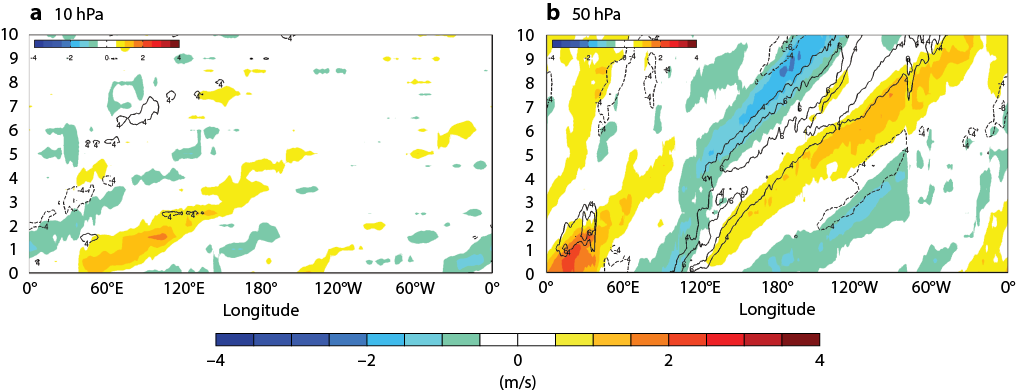
Similar to the way in which the amplitudes of spherical harmonics can be compared, a scale-dependent evaluation of atmospheric circulation can be carried out by using the Hough harmonics to compare forecasts and verifying analyses at each spatial scale (Žagar et al., 2015b). The verification can also be performed in physical space for any mode of interest. This is shown in Figure 5, which presents the root-mean-square errors (RMSEs) of forecasts compared to analyses (00 UTC) for the balanced and unbalanced zonal wind component at a model level close to 50 hPa, averaged between 5°N–5°S.
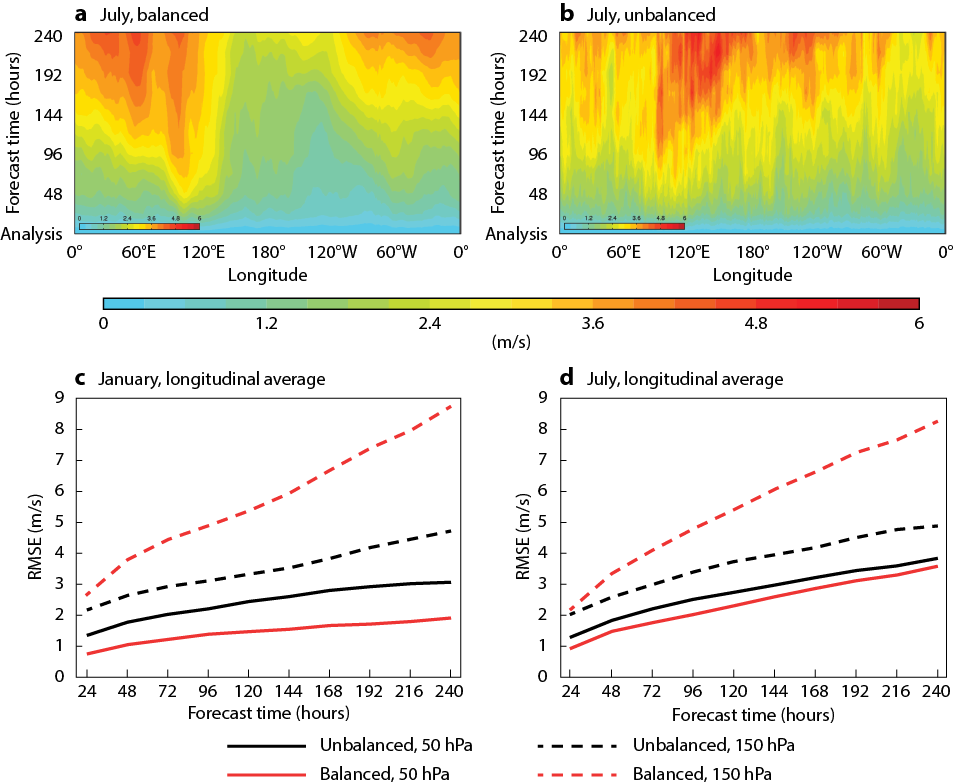
The growth of RMSEs in Figure 5 is associated with the variability of the tropical stratosphere, which is driven by vertically propagating equatorial waves associated with convection. In July, convection is most intense over the maritime continent and the errors in stratospheric circulation first develop here. The RMSEs for the balanced zonal wind appear to propagate westward (Figure 5a). By contrast, the RMSEs of the stratospheric unbalanced zonal wind component propagate eastward in forecasts in both July (Figure 5b) and January (not shown), but the error amplitudes are greater and develop earlier in the forecasts in July. The location of the maximal stratospheric RMSE is not the same in January and July as the most intense convection, which generates vertically propagating IG waves, moves along the equator (not shown).
The fact that RMSEs for balanced flow along the equator in Figure 5a,b appear smoother than RMSEs for unbalanced flow can possibly be explained by the dynamical properties of IG waves and their generation by physical processes. At the same time, these processes may still be somewhat underrepresented in the forecasts, as suggested by Figure 1 and by looking at the growth of the ensemble spread in operational ensemble forecasts (Žagar et al., 2015b).
The growth of zonally averaged tropical forecast errors in the zonal wind component is largest in the balanced component in the upper troposphere. In the 10-day range, the balanced error at level 150 hPa is nearly twice as large as the error in the unbalanced component (Figure 5c,d). The two components initially have similar amplitudes, which indicates that the analysis errors relative to the variability of the wind is higher in the unbalanced component compared to the balanced component, or possibly that the error growth is much higher during the first forecast day. In the stratosphere (level 50) the unbalanced component of error dominates in both January and July but the error growth is greatest in July, when convection is stronger. In the next section we are going to discuss short-range errors by presenting average analysis increments.
Decomposition of analysis increments
Another useful error decomposition is presented in Figure 6, which shows zonal wind analysis increments in autumn 2015 as the mean absolute differences between the analysis and the first-guess forecast. The average increments are small if the short-range forecast (first-guess) agrees with the available observations. The increments are also small if there was no significant error growth in the short-range forecast. In general, one expects the increments to be larger in dynamically active regions with faster intrinsic error growth (e.g. in the presence of convection or baroclinic instability) and in regions with large model uncertainties (error). To understand the nature of errors, the decomposition of the increments into balanced and unbalanced components could be valuable.
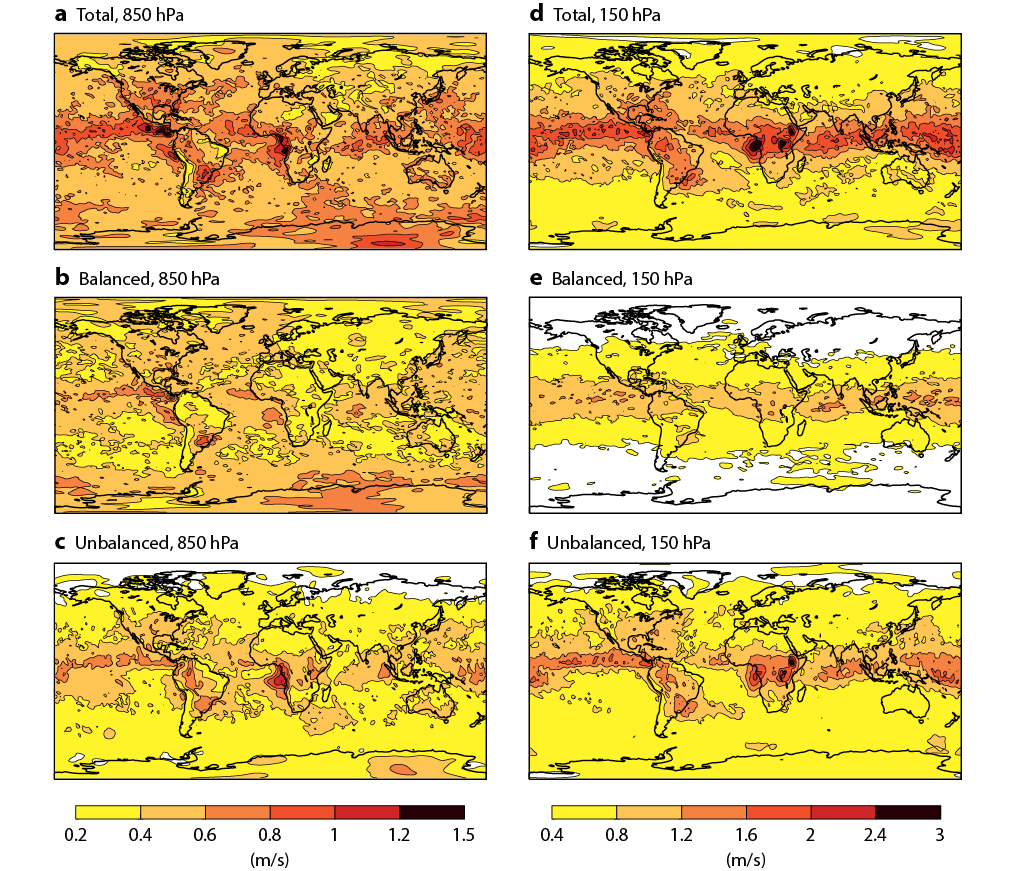
Global analysis increments for all modes, split into balanced and unbalanced modes, are shown in Figure 6 at two model levels. The level close to 150 hPa represents the flow in the upper troposphere in the tropics and in the lower stratosphere in the mid-latitudes. The increments are largest at the 150 hPa level in the tropics. As discussed in Žagar et al. (2015b), this is the region with the largest initial-state uncertainties and the largest initial growth of the spread in ensemble forecasts. Lower in the troposphere, the increments are distributed more evenly and appear smoother, especially for the balanced component in the mid-latitudes. Note also that smaller increments at the 150 hPa level in the extra-tropics are above the tropopause, where variability is significantly smaller.
In the tropics, a larger part of increments is associated with unbalanced modes than with balanced modes at both levels. The largest increments are found over tropical Africa. A further diagnostic into various modes reveals that some of the increments over Africa are associated with the Kelvin modes (not shown). Furthermore, these increments, which are believed to be connected to convection over Africa, are strongest during daytime (18 UTC analysis). There are also big increments in unbalanced flow over eastern Africa, which is related to very localised (and unrealistic) convection in the model over Ethiopia. This feature has been improved in the new IFS model cycle (41r2). Overall, Figure 6 suggests that data assimilation is most difficult in the tropics, where forecast errors grow fastest and where a lack of direct wind observations makes it difficult to constrain circulation in the analyses. Figure 6 also shows that in high-resolution forecasts a significant part of tropospheric analysis increments projects onto unbalanced modes in the extra-tropics too.
Conclusions and outlook
We have presented a new diagnostic technique that can usefully be applied to ECMWF forecasts in the tropics and that complements other methods to validate model performance. Based on a decomposition into balanced and unbalanced (IG) modes, the technique enables balanced flow features, such as individual equatorial Rossby waves, and unbalanced waves, such as Kelvin waves, to be evaluated separately. In this way, we can more easily relate errors in forecasts to initial-state uncertainties and model errors.
We have only given a few examples of how the modal technique can be applied. Combined with similar diagnostics of data assimilation and forecast model performance in the tropics, the results suggest that there is a need for more advanced data assimilation to better constrain large-scale equatorially trapped waves in the analysis. Although the presented upper-troposphere tropical forecast errors grow more rapidly in the balanced modes, the analysis increments at the same levels are larger in unbalanced modes than in balanced modes, suggesting shortcomings in the analysis of unbalanced structures. We focused on large scales where the tropical analysis uncertainties are relatively large and where the ensemble data assimilation could benefit from the use of flow-dependent background-error covariances associated with equatorial wave dynamics.
FURTHER READING
Bechtold, P.M., M. Koehler, T. Jung, F. Doblas-Reyes, M. Leutbecher, M.J. Rodwell, F. Vitart & G. Balsamo, 2008: Advances in simulating atmospheric variability with the ECMWF model: from synoptic to decadal time-scales, Q. J. R. Meteorol. Soc., 134, 1337–1351.
Park, Y.-Y., R. Buizza & M. Leutbecher, 2008: TIGGE: preliminary results on comparing and combining ensembles. Q. J. R. Meteorol. Soc., 134, 2029–2050.
Žagar, N., E. Andersson & M. Fisher, 2005: Balanced tropical data assimilation based on study of equatorial waves in ECMWF short-range forecast errors. Q. J. R. Meteorol. Soc., 131, 987–1011.
Žagar, N., A. Kasahara, K. Terasaki, J. Tribbia & H. Tanaka, 2015a: Normal-mode function representation of global 3D datasets: open-access software for the atmospheric research community. Geosci. Model Dev., 8, 1169–1195.
Žagar, N., R. Buizza & J. Tribbia, 2015b: A three-dimensional multivariate modal analysis of atmospheric predictability with application to the ECMWF ensemble. J. Atmos. Sci., 72, 4423–4444.

