
ECMWF simulations have helped to explain how a fierce storm in June 1944 destroyed one of two harbours built to support the Allied invasion of northern France in World War II.
Within two weeks of the Normandy landings, two temporary harbours had been constructed to support the invasion.
But even as the finishing touches were put to ‘Mulberry A’ and ‘Mulberry B’, a strong storm blew up.
Exceptionally high waves driven by gale-force north-easterly winds destroyed Mulberry A at Omaha Beach. Mulberry B at Arromanches was damaged but survived.
Mulberry B went on to play a key role in the delivery of soldiers, vehicles and supplies to northern France.
ECMWF simulations of meteorological and sea conditions at the time help to explain why one of the harbours was destroyed while the other withstood the storm.
Waves
Reanalysis is a technique which combines past weather observations with modern Earth system models to simulate the state of the atmosphere and other parts of the Earth system in previous decades.
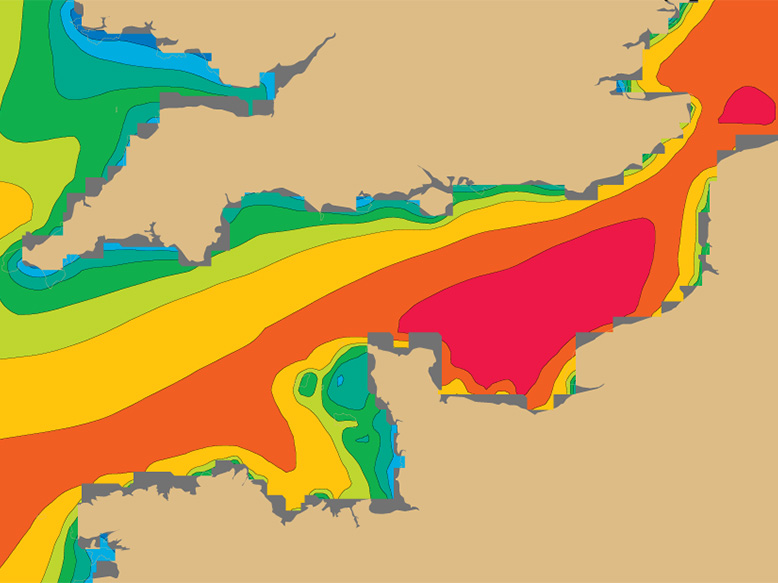
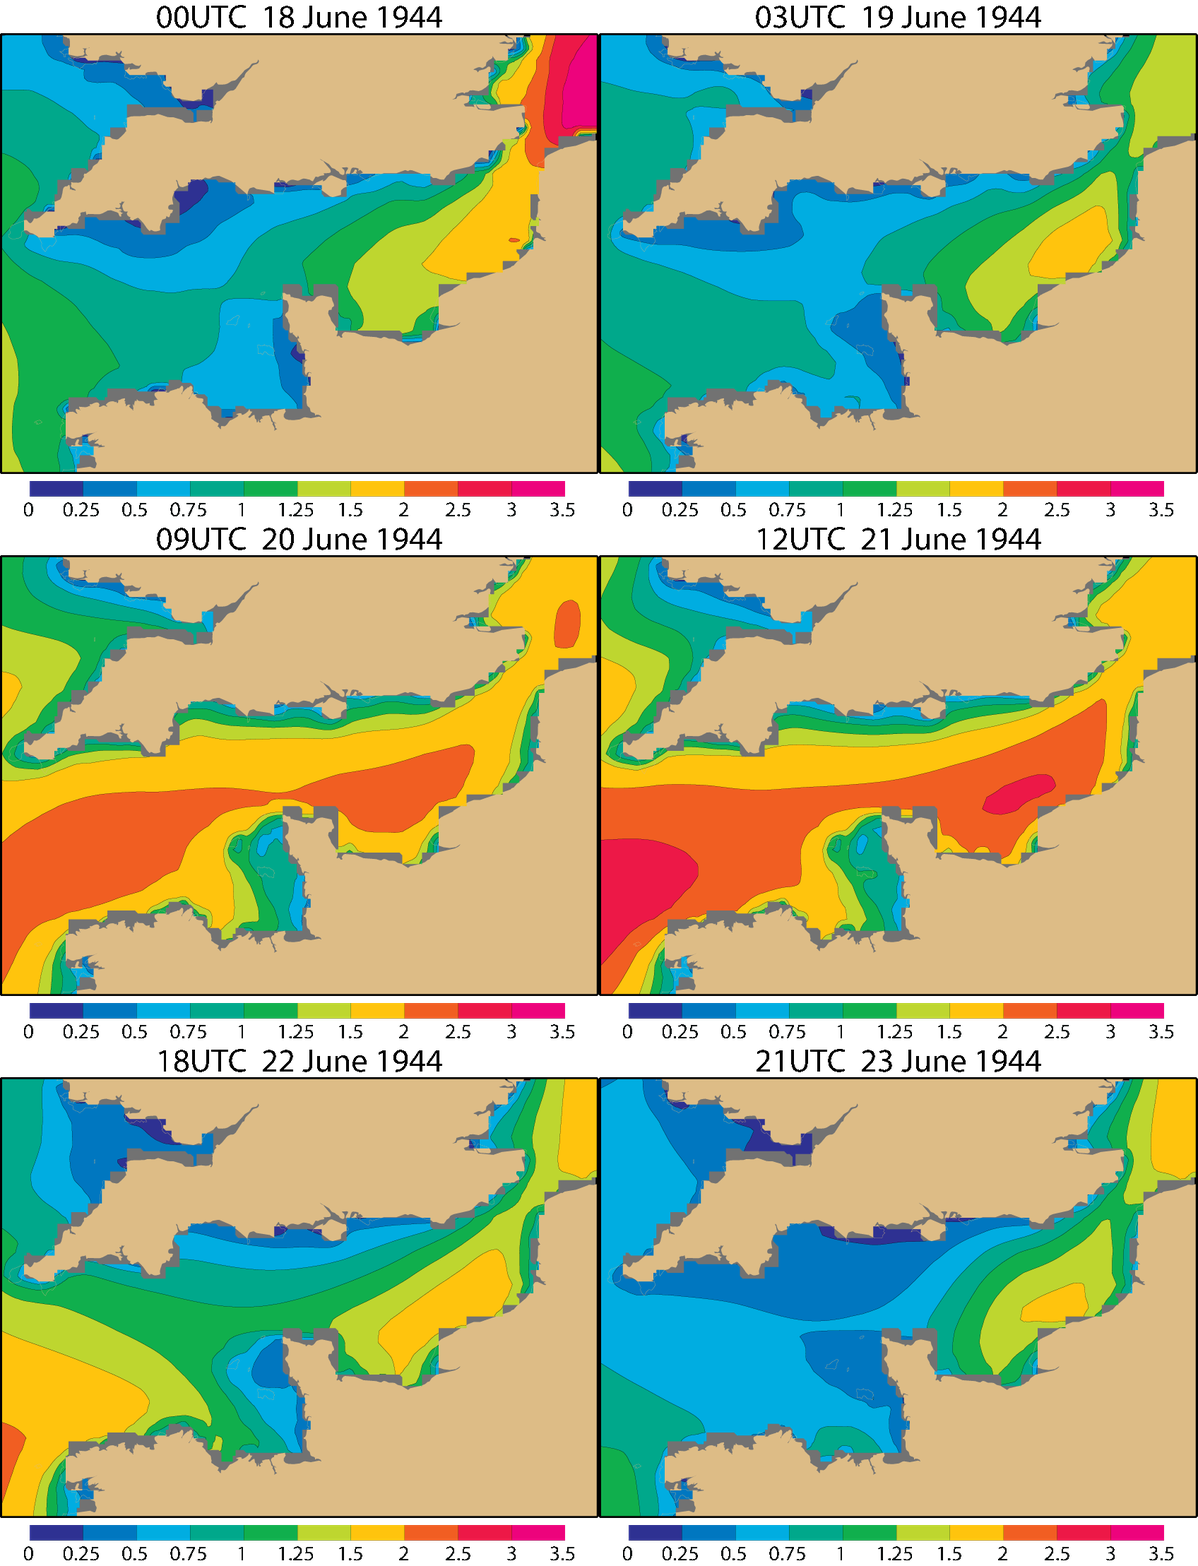
ECMWF reanalysis results for 18 to 23 June 1944 show that significant wave height exceeded 1.5 m off the Normandy shore continuously from the evening of 19 June to the evening of 22 June. It exceeded 2.5 m at 18 UTC and 21 UTC on 20 June.

Animation of significant wave height (metres) for 18 to 23 June from a wave model with a 0.1° grid, driven by winds from successive 6-hour, 9-hour, 12-hour and 15-hour forecasts, produced 12 hourly.
Maximum wave heights are around twice the significant wave height. They reached as high as 5 m at the eastern end of the Normandy beaches at 18 UTC on 20 June, and 4 m close to Omaha beach.
This matches contemporary reports of waves between about 2.5 and 4.5 metres high.
However, ECMWF’s reanalysis does not extend to the actual shoreline, where the damage was wrought on Mulberry A and B.
A recent case study published in the Journal of Ocean Engineering and Marine Energy used a wave model optimised for near-shore conditions to fill the gap.
The authors used the SWAN model developed at Delft University of Technology, forced by ECMWF’s reanalysis, to estimate significant wave height at Mulberry A and Mulberry B.
They found a significant difference between the sea states at the two harbours, with reduced wave heights at Mulberry B as the waves approached the breakwaters.
“We attribute this to differences in the angle at which the waves were approaching and the presence of banks immediately northeast of Mulberry B that dissipated and diverted some of the wave energy,“ says ECMWF scientist Jean-Raymond Bidlot, one of the authors of the study.

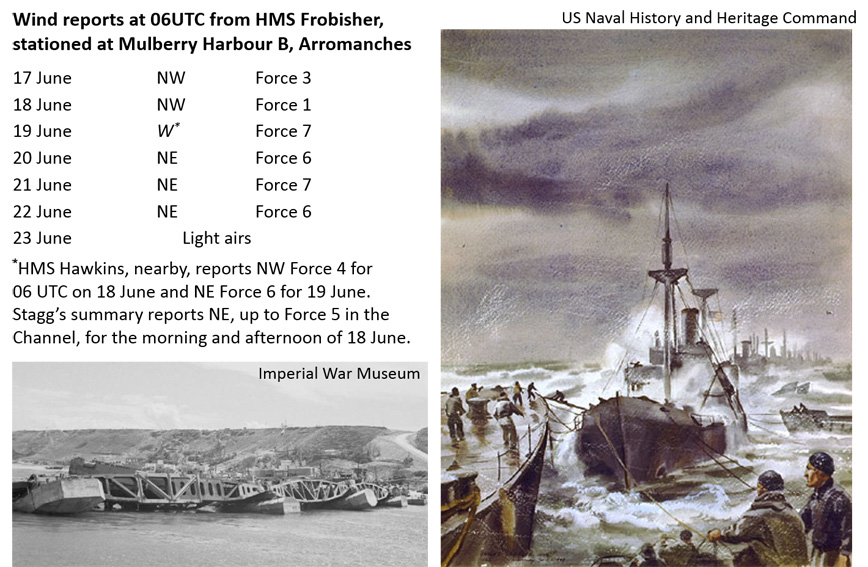
Wind reports and images for the storm of 19-22 June 1944. Images are from the Imperial War Museum and the US Naval History and Heritage Command.
Pressure and wind
ECMWF’s reanalysis of waves is itself driven by a reanalysis of the weather at the time.
Pressure and wind fields driving the wave model were obtained using a version of the ERA-20C reanalysis, which covers the entire 20th century.
ERA-20C uses surface pressure and marine surface wind observations. For ECMWF’s reanalysis of the weather during the D-Day period, upper-air observations were also used.
In addition, forecasts were run to three days ahead from 00 UTC and 12 UTC at 16 km resolution to enhance the realism of wind and cloud fields for 18 to 23 June.
These downscaled winds were used to drive a separate ocean-wave model with a spatial resolution of about 11 km to reconstruct the sea state.

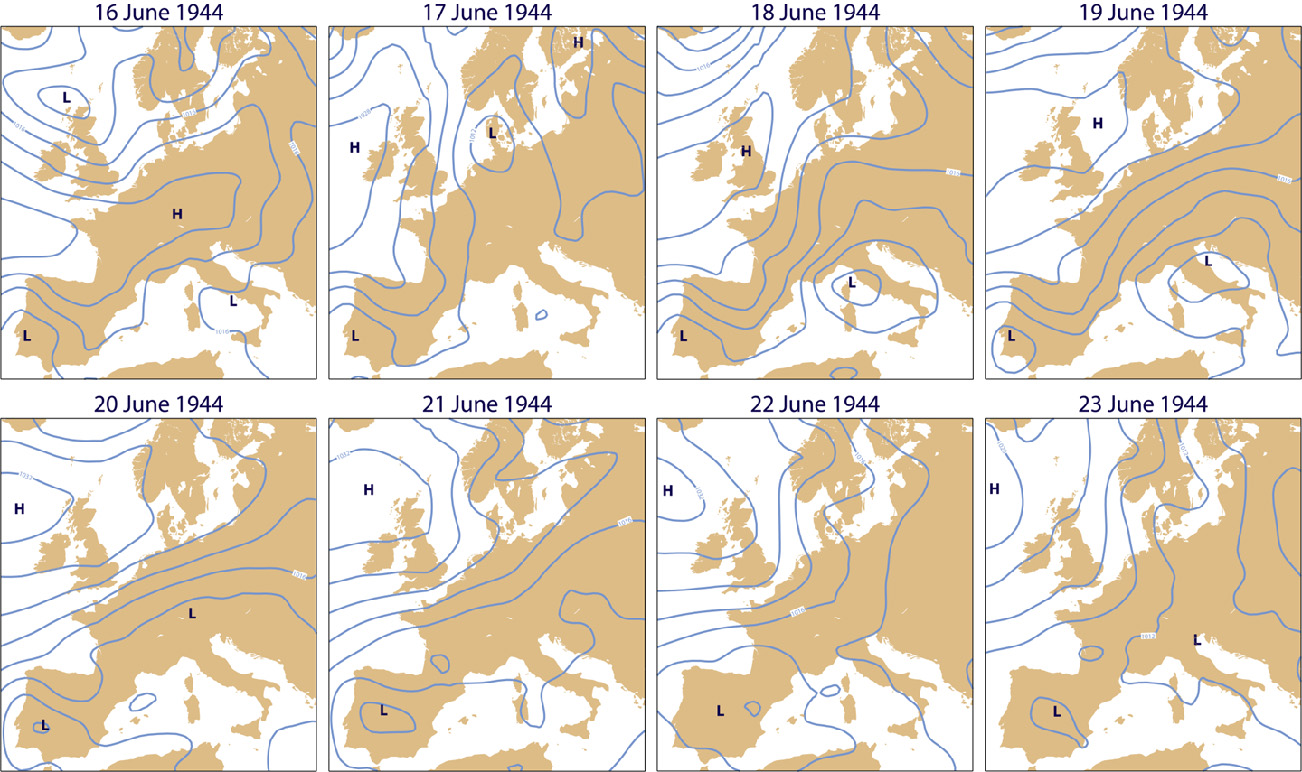
ERA-CLIM surface-pressure analyses (contour interval 4 hPa) for 00 UTC from 16 to 23 June 1944.
As the surface pressure charts show, between 16 and 23 June a strong and persistent gradient in surface pressure developed over the southern North Sea and Channel, weakening only towards the end of the period.
Winds were strongest on the evening of 20 June, when they reached almost 15 m/s, or Beaufort Force 7.

Cloud cover and 10 m wind from short-range high-resolution forecasts for 18 UTC on 19 June 1944 (left), 06 UTC on 20 June (middle) and 18 UTC on 20 June (right).
The long fetch of winds from the North Sea, through the Dover Strait and along the Channel to the Normandy shore drove waves onto the beaches and harbours that proved fatal for Mulberry A but, crucially, not for Mulberry B.
Further information
A special web page gives a comprehensive account of ECMWF’s reanalysis of the D-Day period, produced by a team of ECMWF scientists led by Adrian Simmons.
