
In March 2017 ECMWF received an email from an EU expert sent to Peru as part of a UN team to help deal with a devastating flood disaster.
Maria-Helena Ramos, a hydrological forecasting specialist from Irstea in France, asked whether the Centre could make its precipitation forecasts available.
The idea was to help the authorities in Peru issue warnings and to support the relief effort.
In line with ECMWF’s rules for the dissemination of real-time data in exceptional circumstances, the Centre agreed.
Phone and Skype contact with Peru’s national meteorological and hydrological service (SENAMHI) was established. Forecast data such as hourly precipitation products were made available. Luisa Sterponi, a consultant at the Peruvian Defence Ministry, was also keen to receive the products since the Ministry is in charge of the response to national emergencies.
There was no time to waste: heavy rain had fallen in parts of the country since mid-January. Several rivers had burst their banks causing flooding and damage to housing and infrastructure in urban and rural areas.
By the end of March, the disaster had left 101 people dead, 353 injured and 19 missing, while more than 200,000 homes had been destroyed or had become uninhabitable. And the rain continued to fall.
“With the help of Maria-Helena and Luisa, the necessary coordination between ECMWF and the Peruvian authorities was achieved within a week,” says Umberto Modigliani, the Head of User Support at ECMWF.
![]()
![]()
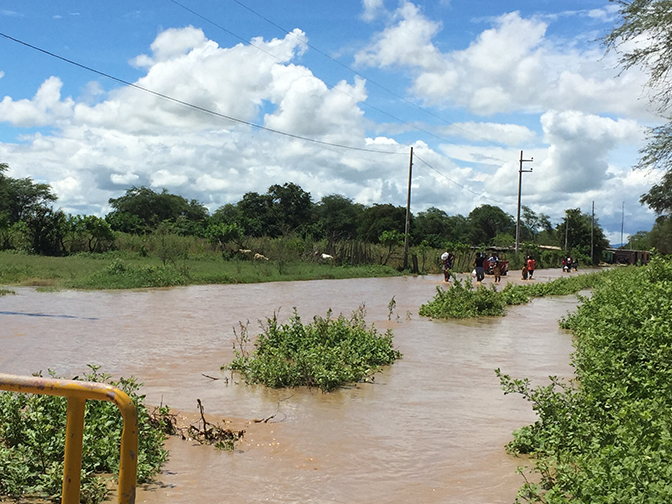
Flooding following heavy rainfall in parts of Peru in the first few months of 2017 caused damage to housing and infrastructure. (Photos: Maria-Helena Ramos)
Why so much rain?
The anomalous rainfall is believed to be connected to warm sea-surface temperatures along the coast, a phenomenon called ‘El Niño Costero’.
“The high temperatures were probably caused by an equatorial Kelvin wave in the ocean,” says ECMWF scientist Linus Magnusson. “This feature propagated from the Western Pacific, where it was first observed in the autumn of 2016 as a positive sea-surface height anomaly.”
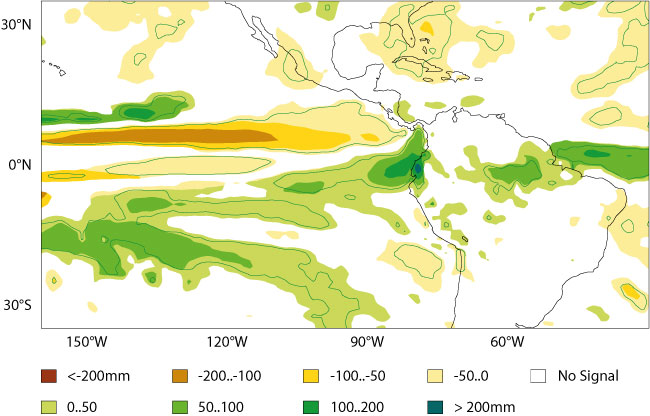
Probably as a result of capturing the Kelvin wave early on, ECMWF’s seasonal forecast was able to predict that wet conditions were in store several months ahead: the forecast from 1 November 2016 showed a wet anomaly over the region in the February to April average.

Ensemble mean anomalies for precipitation in the period February–April 2017 in the ECMWF seasonal forecast from 1 November 2016.
How did ECMWF help?
ECMWF provided a range of products: ensemble forecasts (ENS), which describe the range of possible scenarios and their likelihood of occurrence, and high-resolution forecasts (HRES).
Access to binary data in the standard meteorological format allowed local services to process the information through their visualisation tools and impact models.
ECMWF also made a new test product for point rainfall available. The product is based on ensemble forecasts, which undergo statistical post-processing to produce probabilistic rainfall forecasts for points. The idea is to provide better guidance in cases of localised extreme rainfall.
“Data were in fact sent both ways as SENAMHI provided ECMWF with local observations of precipitation,” ECMWF scientist Fatima Pillosu says. “This helped us to verify the new point rainfall product.”

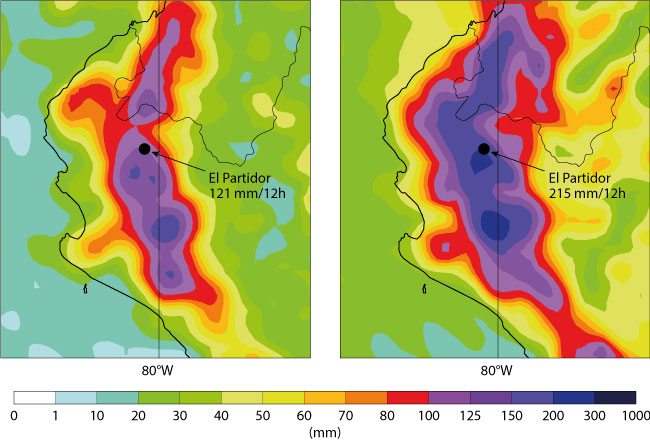
El Partidor in the Piura region saw 258 mm of rain on 3 March 2017, most of which fell between 4 p.m. and 10 p.m. local time. The charts relate to ECMWF forecasts of 12-hour precipitation issued on 27 February 2017 at 00 UTC (t+114 to t+126). They represent the 98th percentile for total precipitation from the raw ensemble forecast (left) and from the point rainfall product (right). The risk area for heavy rainfall was well identified in both forecasts even five days in advance, but the raw ensemble did not suggest the possibility of the observed amount of 258 mm. The point rainfall product, on the other hand, suggested that there was a chance, albeit a small one, of such an event occurring.
What difference did it make?
ECMWF web products helped SENAMHI forecasters to issue warnings of heavy rainfall that was likely to cause new flooding or to exacerbate existing flooding. Special attention was also paid to events that could hinder rescue operations or endanger the lives of emergency workers.
The daily total precipitation forecast from ECMWF’s high-resolution forecasts (HRES) was combined with SENAMHI’s climatological and hydrological observations (PISCO).
The resulting maps showed the areas where daily accumulated total precipitation exceeded the 90th, 95th and 99th percentiles of the local climatology. This made it possible to highlight the areas facing a high risk of unusually heavy rainfall.
![]()
Meteorological warning and Categorized Rain Maps (CRM) issued for the warning from 21 to 23 April 2017, using ECMWF HRES (forecast issued on 18 April 2017 at 12 UTC). These charts do not cover days on which the rainfall was at its heaviest. The heaviest rainfall occurred in March, but SENAMHI did not have access to ECMWF data for those days.
ECMWF products were used alongside satellite images and local reports to enhance the accuracy of daily local rainfall forecasts and to enable better warnings of extreme rainfall and river floods.
The cooperation with ECMWF has led SENAMHI to evaluate the possibility of acquiring a full NMHS (national meteorological and hydrological service) non-commercial licence to continue to have access to the full range of ECMWF forecast products.
Top photo: Maria-Helena Ramos. All photos are from the Environmental Expert Support Mission United Nations Disaster Assessment and Coordination Flooding Assessment Technical Report Peru – May 2017 (PDF).
