
August 2019 marks 40 years of operational forecasting at ECMWF.
On 1 August 1979 ECMWF produced its first operational medium-range forecast for Member States. This major achievement marked the first milestone on the road towards producing useful weather forecasts beyond two to three days, and was achieved less than four years after the Convention which created ECMWF was signed on 1 November 1975.
The first forecast
Operational medium-range forecasting began on 1 August 1979 with forecasts produced to ten days ahead, five days per week, of which the first seven days were disseminated to Member States.
"1 August 1979 was a very tense day for the Centre staff. After many months of work, preparation and testing, the day had arrived for the first operational medium-range forecast to be made at the Centre and dispatched in real-time to national meteorological services in Member States. The forecast was to be based on an initial state at 12 Z on the 1 August and results as far as 7 days were to be made available to Member States."
These were the opening words of the editorial to ECMWF’s October 1979 Technical Newsletter written by Roger L. Newson, then head of the Meteorological Division, after ECMWF’s first-ever operational forecast had been produced and disseminated to the Member States. Newson went on to describe how the day had started smoothly. Input observation data in raw GTS form had been copied to magnetic tape by the United Kingdom Meteorological Office and brought across to the Centre for decoding and quality control.
It was during the evening that things started to go wrong. Computer system problems arose, leading to the decision to dead-start the Cray-1 with a different version of the operating system. Somehow, this universally accepted method proved itself once again, and the Centre’s first operational forecast was produced, with only a four-hour delay.
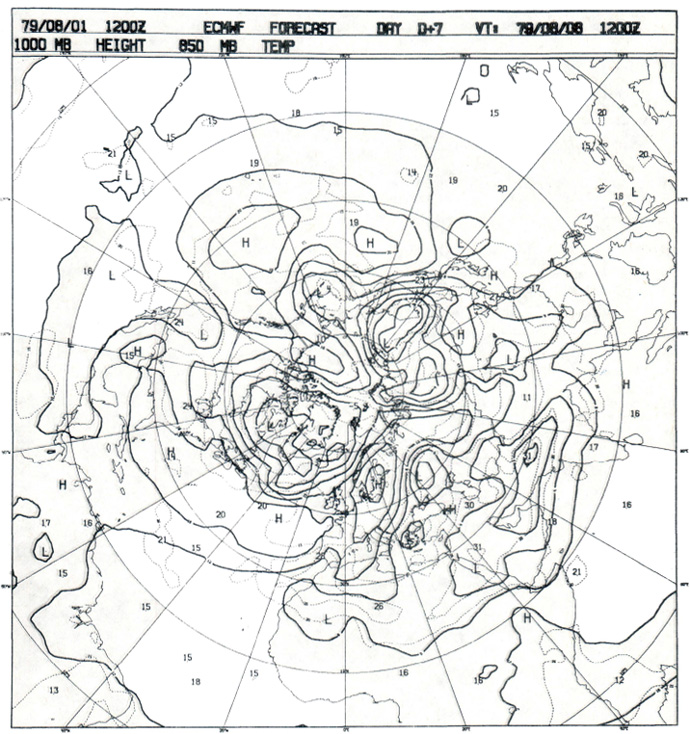
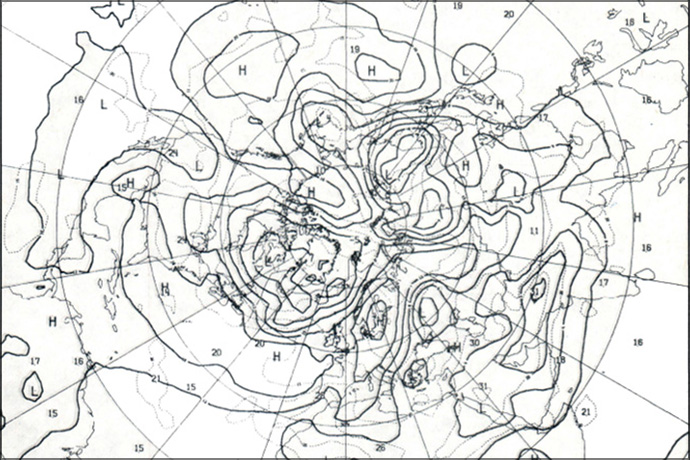
The first operational ECMWF forecast: Seven-day forecast of the 1000 hPa geopotential height and 850 hPa temperature made from 1 August (i.e. verifying on 8 August 1979).
The model had a resolution of 210 km with 15 levels in the vertical direction and used about 5 hours of CPU time on the Centre’s Cray-1A computer to produce a 10-day forecast. It was an atmospheric model, with the oceans represented by a sea-surface temperature which was kept constant at each grid-point during the forecast.
The ECMWF Annual Report 1979 records that the quality of the first forecasts varied with season and with the meteorological situation. On some occasions forecasts were “remarkably good” up to 10 days, while in other situations the practical limit of predictability was less than a week. Possibly for this reason, ECMWF had made the decision that only the first 7 days of the 10-day forecast were to be disseminated to Member States in these early days.
Forty years on
Four decades later, improvements in modelling and data assimilation, coupled with vastly greater computing power and observational coverage, have led to a large diversity of forecast products and applications.
It is not the purpose of this article to provide an exhaustive list of all the advances that have contributed to this progress, but rather to illustrate, through the examples below, the impact of some of the most striking developments.
The move to probabilistic forecasts
Ensemble forecasts were introduced operationally at ECMWF in 1992, following years of research and development. By presenting the range of future weather possibilities and their likelihood of occurring, an ensemble or ‘probabilistic’ forecast provides information about the uncertainty associated with a forecast that a single ‘deterministic’ forecast does not offer. Today ECMWF's ensemble comprises 50 members.
The plot below illustrates some of the additional information available to users from an ensemble forecast over a deterministic one. It shows a 7-day (re-)forecast from the same initial date (1 August 1979) using the new Copernicus “ERA5” ensemble reanalysis as initial conditions, and the current operational forecast model (Cycle 46r1) coupled to the ocean.
The black contours show the ensemble-mean 1000 hPa height field, which can be compared with our original forecast. We do see some similar features – including the Low over northwest Canada. The grey shading in the re-forecast plot shows the ensemble spread, which indicates substantial uncertainty in the Low. In the operational forecast made in 1979, there was no quantification of uncertainty.
Overlaid in the re-forecast plot for Europe is the ensemble control forecast precipitation (day 6.5 to 7.5). The dual colour palette allows us to show with bolder colours where, additionally, the ensemble is indicating over 50% chance of precipitation.
Similarly, overlaid for North America is the control forecast 2m temperature. Bold colours here indicate over 80% chance that temperatures will be less than 5oC – associated with the northerly flow behind the Low.
For Tibet, the plotted topography highlights how sharp features such as the Himalayas can be represented at the present-day ensemble forecast resolution.
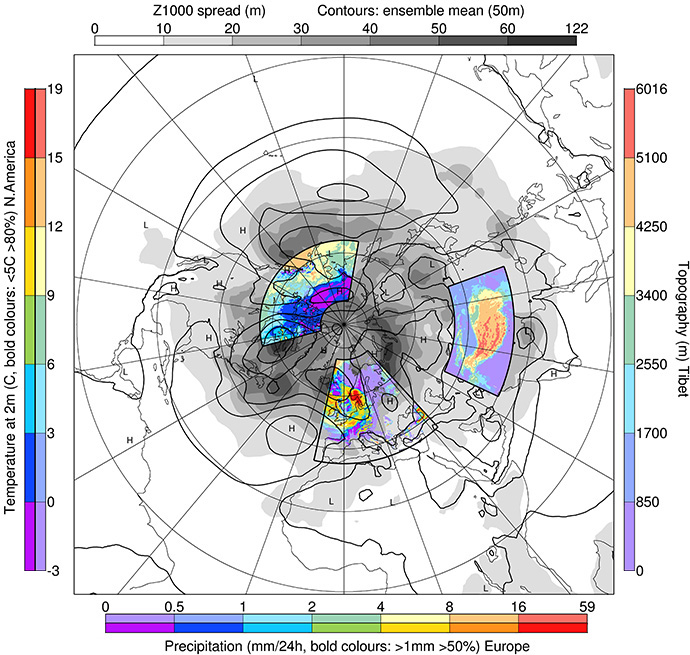
Ensemble re-forecast of ECMWF’s first operational forecast. Initial conditions on 1 August 1979 at 12Z for the 50-member ensemble are derived from the ERA5 ensemble reanalysis. This 7-day forecast uses the current operational model (IFS Cycle 46r1). Contours show the ensemble-mean 1000 hPa height field which can be compared with the first operational forecast shown in the previous figure. Grey shading shows the ensemble standard deviation. The coloured regions highlight the detail and ensemble information available in present-day forecasts (see main text for more information).
Advances in data assimilation
The re-forecast shown above benefits from an improved model and better data assimilation techniques (4D-Var data assimilation introduced some 22 years ago, which is now incorporated within our ensemble of data assimilations, EDA), but it is still based on considerably fewer observations than are available today. The availability of millions of additional observations provided by satellites has also allowed us to improve our initial conditions, and hence our forecast at all ranges.
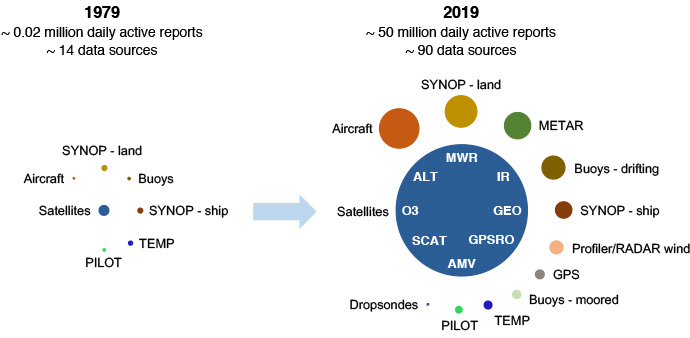
Representation of the approximate proportions of different data types available for use in ECMWF forecasts in 1979 and in 2019.
Views from space: predicting cloud systems
To illustrate the huge progress made over the past decades in the prediction of cloud systems in the Integrated Forecasting System (IFS), simulated visible images of our planet as seen from a geostationary satellite were created using solar fluxes at the top of the atmosphere from two different 72h forecasts. These were initiated on 1 August 1985 at 12h UTC as forecast and satellite data from earlier years are not available in ECMWF’s archive.
The first forecast (top left) is the original 72h operational forecast from 1985 (model cycle 24), which used a resolution of around 200 km (at the equator). The second forecast (top right) is a 72h integration using today’s IFS Cycle 46r1 at the current operational resolution of 9 km (deterministic model). This forecast was initialized from the ERA5 reanalysis, which is expected to provide more accurate initial conditions than the 1985 original operational analysis, due to improvements in the model and data assimilation as well as the larger number of observations used in ERA5. In other words, the second forecast should exhibit the combined benefits of using a much higher resolution, a better model and improved initial conditions.
To confirm this, a visible image of the Earth taken by EUMETSAT’s geostationary satellite Meteosat-2 on 4 August 1985 at 12h UTC is also displayed (bottom left) for validation purposes. It is important to be aware that the two simulated images in the top panels are based on solar fluxes averaged over the previous 12 hours (the original archiving frequency back in 1985). In contrast, the Meteosat-2 image can be considered as a snapshot of our planet.
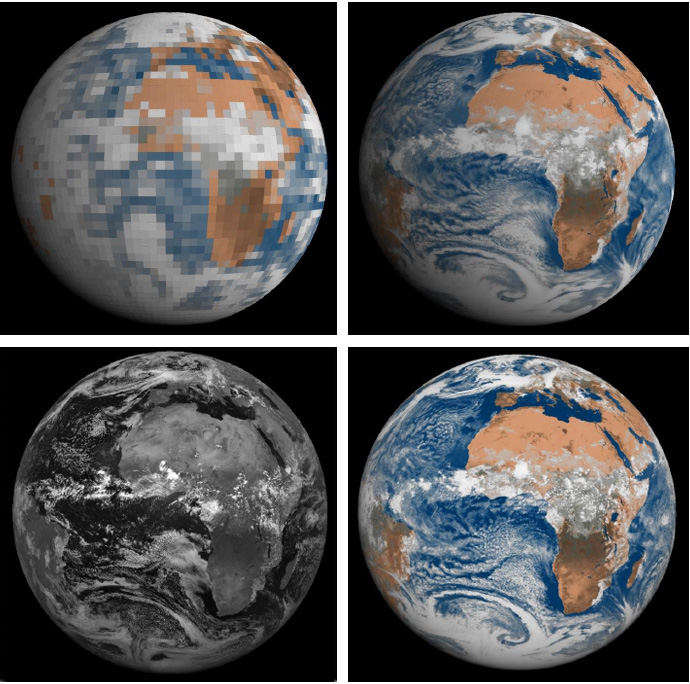
Simulated visible images based on 12h-averaged solar fluxes from a 72h forecast from the original 1985 operational archive (top left; 200 km resolution) and from a present-day 9 km resolution IFS model version initialized from ERA5 reanalysis (top right). The forecast starting date is 1 August 1985 at 12h UTC. Bottom left: EUMETSAT’s Meteosat-2 satellite visible image used for validation (©EUMETSAT). A corresponding simulated image based on 1h-averaged solar fluxes is also shown on the bottom right panel.
A comparison between model and satellite is therefore not expected to yield a perfect match; however, simulated and observed persistent large-scale cloud patterns should still look rather alike. The bottom-right panel provides a hint of the effect of the time averaging by displaying a simulated image produced from the same forecast as in the top-right panel but computed using solar fluxes averaged over 1 hour instead of 12 hours.
A comparison of the original (top left) and the “modern” (top right) simulated images with the Meteosat-2 image clearly illustrates the superiority of the recent IFS over the earlier version of the model. Even though the 1985 model version was able to properly position several of the major cloud systems, their main structure sometimes looks rather wrong.
For instance, the storm affecting Western Europe is present in both model versions, but its frontal regions are not well represented in the 1985 forecast. Similarly, the highly elongated re-curving cloudy frontal region over the South Atlantic Ocean is not correctly predicted by the older model. In addition, the comparison of the two bottom panels confirms that the high-resolution modern IFS version combined with ERA5 initial conditions agrees rather well with the satellite. In fact, an even better level of agreement would be expected in a present-day forecast since far more observations are used in a current operational analysis than in the ERA5 reanalysis for 1985.
These figures illustrate the tremendous improvement in the prediction of clouds in the IFS over the past decades, through successive increases in vertical and horizontal resolutions, through all the developments in the dynamical core and physical parametrizations used in the forecast model, and also through the efficient assimilation of an ever-growing number of observations, especially from satellites.
Looking ahead
The start of real-time operational forecasting at ECMWF was an important step, testament to the vision of those European nations who saw the future of meteorology as an exercise in global collaboration. Today, the products developed and disseminated by ECMWF cover much broader ranges, from medium to seasonal, from only the atmosphere to a more complete Earth-system, including waves, ocean, sea-ice, atmospheric composition, flood and fire.
This anniversary gives us an opportunity to thank and salute the men and women who have made ECMWF over the past decades, and the many from across Europe and far beyond, who have collaborated with them to deliver scientific advances that are contributing year on year to protecting life and property.
This is only the beginning and ambitious goals lie ahead.
We would like to thank for their contributions to this article Mohamed Dahoui, Hans Hersbach, Simon Lang, Philippe Lopez, Baudouin Raoult, Mark Rodwell, Irina Sandu, Adrian Simmons and the DWD Library Service.
Further reading
- ECMWF Annual Report 1979
- ECMWF Technical Newsletter No. 5
- ECMWF Technical Newsletter No. 4
- ‘25 years since the first operational forecast’ in ECMWF Newsletter No. 102
- Woods, A. (2006). Medium-range weather prediction. New York: Springer.
