
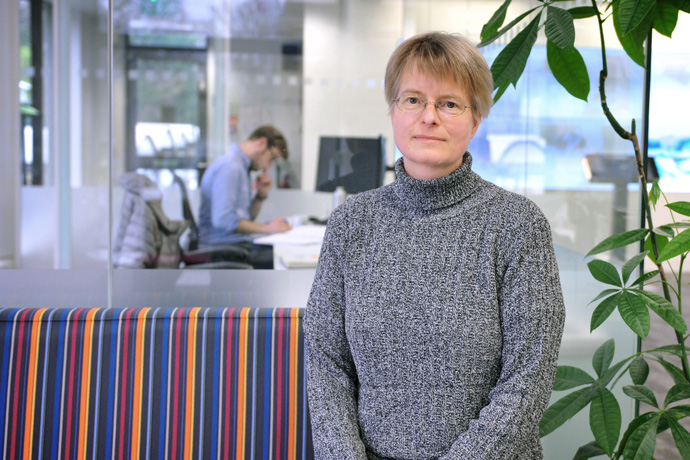
Antje Inness joined ECMWF in the year 2000 to work on satellite observations of water vapour and ozone.
There are signs that ozone levels over Antarctica are slowly recovering. ECMWF scientist Antje Inness harnesses the power of new satellite instruments to monitor this trend and other developments in atmospheric composition and air quality.
As a trained meteorologist, for her PhD she specialised in the exchange of water vapour between different layers of the atmosphere.
When there was an opening at ECMWF to work on satellite observations of water vapour and ozone for numerical weather prediction, she seized the opportunity.
It proved perfect preparation for a major European project Antje joined in 2005: the development of a system to monitor and predict greenhouse gases, reactive gases, aerosols and regional air quality.
“Having worked on ozone, I specialised in the reactive gas aspect of the project. With the help of colleagues, it was easy enough to learn the additional chemistry I needed to know,” Antje recalls.
Today the project has become a fully-fledged operational service: the Copernicus Atmosphere Monitoring Service (CAMS), implemented by ECMWF on behalf of the European Union.
Antje prepares and assesses reactive gas data from new satellite instruments for operational use by CAMS, and she monitors their quality once they are used in operations.
One focus of her work over the last year or so has been the TROPOMI instrument carried by the Sentinel-5P satellite launched in October 2017.
This CAMS animation shows the evolution of ozone in the atmosphere during the 2018 Antarctic ozone hole season. A full review of the 2018 Antarctic ozone hole season is available on the CAMS website.
Unprecedented resolution
“The launch of Sentinel-5P by the European Space Agency (ESA) as part of the EU’s Copernicus Earth observation programme was a major boost for the monitoring and prediction capabilities of CAMS,” Antje says.
“This is the first Copernicus satellite mission dedicated to atmospheric composition.”
The TROPOMI instrument measures radiation at different wavelengths at the top of the atmosphere. From this it is possible to derive information on the amount of ozone, carbon monoxide, nitrogen dioxide, sulphur dioxide, formaldehyde and methane in the atmosphere.
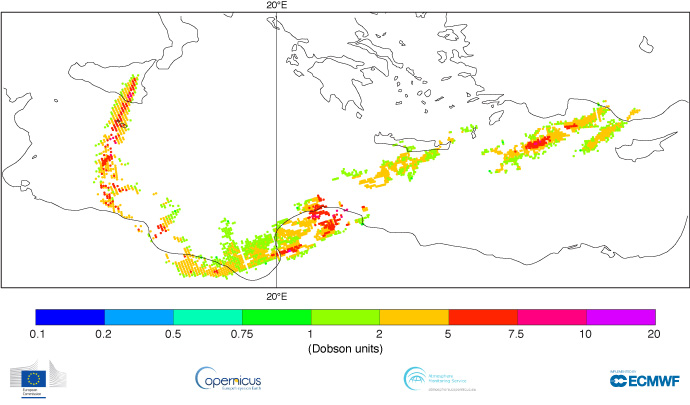
TROPOMI detected this long plume of sulphur dioxide on 26 December 2018. The source of the plume was the eruption of Mount Etna in Sicily.
“TROPOMI gives us data on reactive gases in the atmosphere at the highest resolution yet: 3.5x7 km for ultraviolet and visible light, and 7x7 km for shortwave-infrared radiation,” Antje says.
Ozone, for example, is detected by analysing ultraviolet and visible light. Its distribution in the atmosphere matters for several reasons.
Ozone in the stratosphere (between about 10 and 50 km altitude) is important to shield life from some of the sun’s harmful ultraviolet radiation. Near the surface, on the other hand, it is a pollutant which can cause breathing difficulties and damage vegetation.
Knowledge of ozone levels is also important for numerical weather prediction since ozone in the atmosphere influences radiative fluxes.
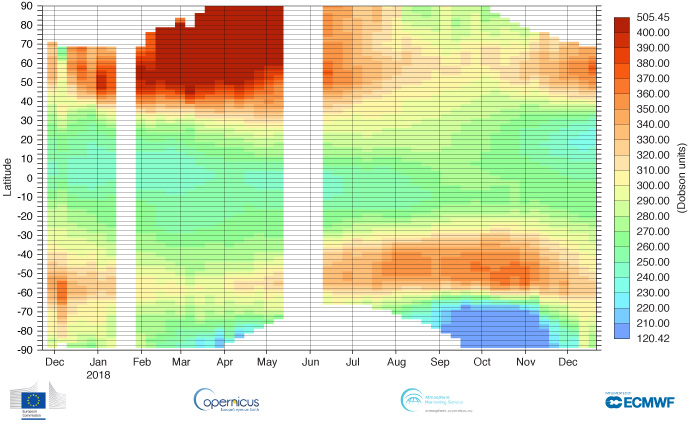
Mean TROPOMI total column ozone by latitude from the end of November 2017 to mid-December 2018. The highest values can be seen in the northern hemisphere during spring and the lowest values over Antarctica during the ozone hole season (September to November). Blank spaces mean that no data are available.
CAMS uses ECMWF’s Integrated Forecasting System (IFS) to monitor and predict atmospheric composition across the globe.
“TROPOMI data for ozone are now routinely assimilated into the model to help analyse the atmosphere’s ozone content and determine the initial conditions for forecasts,” Antje says.
“However, we had to carry out a lot of preparatory work and testing between receiving the first TROPOMI data in late 2017 and starting to assimilate them in December 2018.”
Multi-step process
“To start with, a lot of work goes into converting the data we receive into a format we can use in the model,” Antje explains.
Then the quality of the data is assessed by comparing them with the CAMS analysis.
“Using the CAMS global analysis as a benchmark enables a comprehensive and rapid assessment of the data. We communicate the results to the data provider, in this case ESA and its contractors, so that any data quality problems can be addressed.”
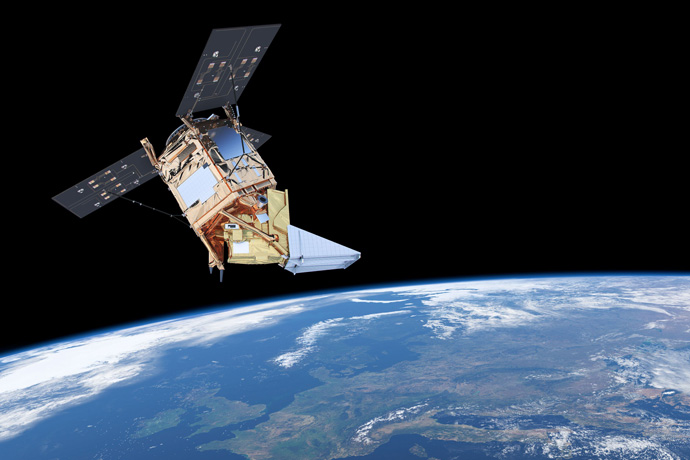
Sentinel-5P is intended to bridge the gap between the retirement of the Envisat satellite and NASA's Aura mission and the launch of Sentinel-5. (Image: ESA/ATG medialab)
Finally, tests are carried out to see what happens when the data are assimilated into the CAMS model.
“We look at the effect of assimilating the data by assessing the analysis with and without the new data against independent observations,” Antje says.
For ozone, the CAMS model was already well constrained by data from other satellite instruments. Nevertheless, Antje found that using the TROPOMI data brings some regional improvements.
For carbon monoxide, the new data make a unique contribution. As a result, they have a bigger effect on the CAMS analysis.
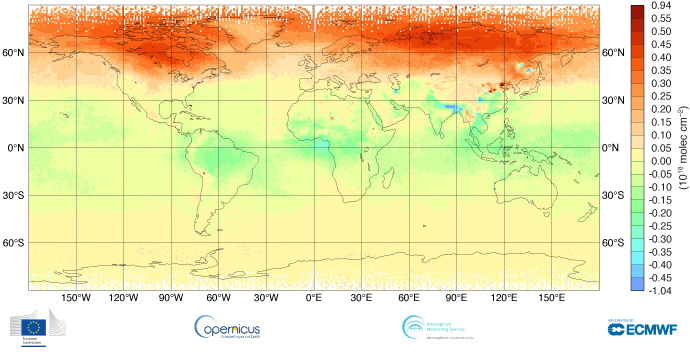
The plot shows differences between the CAMS analysis and TROPOMI observations of total column carbon monoxide (CO), averaged over the period 28 January to 3 May 2018. It shows that in the northern hemisphere, beyond about 40°N, TROPOMI sees higher levels of CO than the CAMS analysis. The CAMS analysis is known to underestimate CO in the northern hemisphere extratropics, particularly during winter/spring and in the lower troposphere.
CAMS reanalysis
Antje’s responsibilities also include the coordination of the CAMS global reanalysis of atmospheric composition.
Reanalyses combine model information with data assimilation to provide a consistent and comprehensive record of past conditions in different components of the Earth system.
In September 2018, a new CAMS reanalysis (CAMSRA) covering the years 2003 to 2016 was released. It will be extended to subsequent years by adding one year each year.
“CAMSRA uses a relatively recent version of ECMWF’s Integrated Forecasting System, IFS Cycle 42r1, and it has a greater horizontal resolution than its predecessor,” Antje says.
“It also provides data on more chemical species at a better temporal resolution than previous reanalyses, and more and newly reprocessed satellite datasets were assimilated to produce it.”
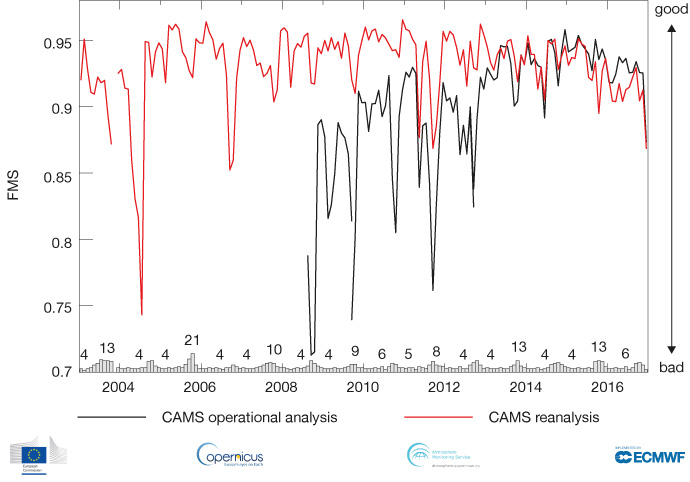
A key advantage of reanalysis over the operational analysis is that its quality is more consistent over time. The plot shows the Figure of Merit in Space score (FMS), which measures the fit of model profiles to observations, for vertical ozone profiles at the Antarctic Neumayer station. The bar chart at the bottom shows the number of ozonesonde profiles per month used for validation.
Like all CAMS data, the reanalysis data are freely available. They can be used to analyse the state of the atmosphere or to identify trends that have developed over the past few years or decades.
For all her successful work on CAMSRA and TROPOMI, Antje does not intend to rest on her laurels.
“I look forward to working on the next new datasets relevant for atmospheric composition, which will come from EUMETSAT’s Metop-C satellite launched in November 2018.”
