
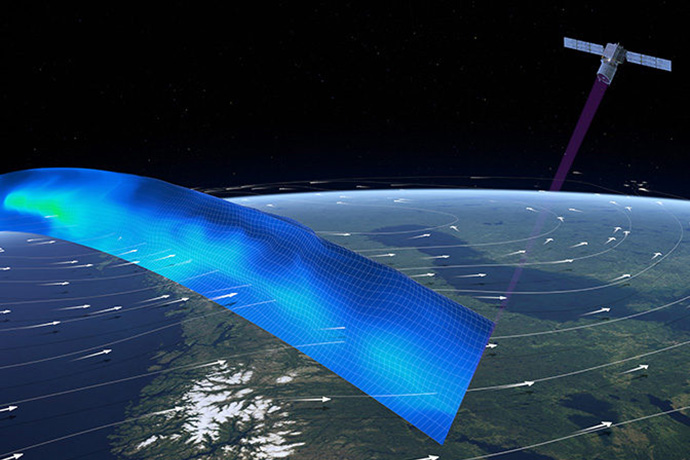
Aeolus is a polar-orbiting satellite which sends laser light into the atmosphere and measures the backscatter to obtain information on winds in the direction perpendicular to the satellite’s path. (Image: ESA/ATG Medialab)
ECMWF started assimilating wind data from the European Space Agency's ground-breaking Aeolus satellite operationally on 9 January 2020 after tests showed that they significantly improve weather forecasts.
Aeolus was launched in August 2018 to test the usefulness of direct wind profile observations from space for numerical weather prediction. It works by measuring the backscatter of laser light from air molecules (‘Rayleigh-clear’ data) and from clouds and aerosols (‘Mie-cloudy’ data).
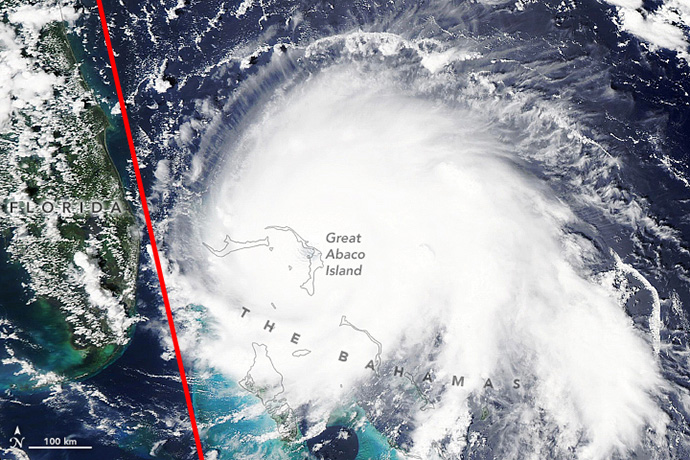
The Aeolus satellite passed close to Hurricane Dorian as the storm stalled over the Bahamas, as shown in this image from NASA’s Aqua satellite taken at 1805 UTC on 1 September 2019. The red line has been superimposed to indicate Aeolus’s path. The Aeolus wind data for that path and beyond, from about 6°N to 42°N, are shown below. (Satellite image: NASA)
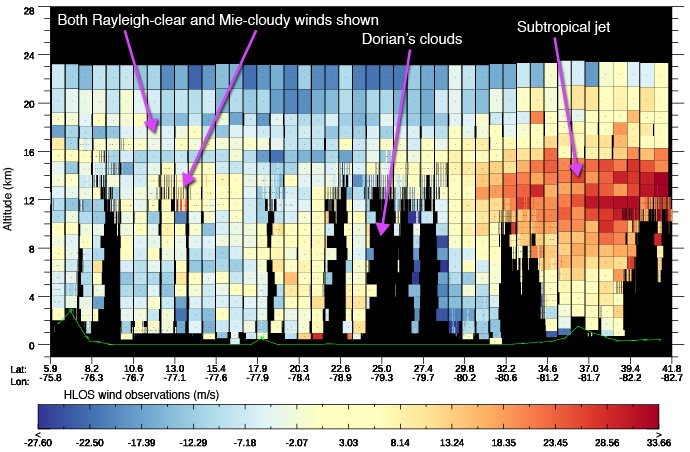
Aeolus horizontal-line-of-sight (HLOS) wind observations, measured in the direction of the laser beam and projected onto the horizontal plane, on 1 September 2019 between about 6°N and 42°N, including the path near Hurricane Dorian shown in the satellite image above. The data are a combination of Rayleigh-clear and Mie-cloudy data.
The Aeolus observations being assimilated come from a second laser switched on in June 2019 after the first laser had lost a fraction of its power. The second laser has been found to deliver more stable power at sufficiently high intensity.
Tests carried out at ECMWF have demonstrated that the impact of the new observations on forecasts in the southern hemisphere and the tropics is comparable to that of some other major components of the Earth observing system.
Several other numerical weather prediction centres have also found big improvements in weather forecasts when assimilating Aeolus data in test experiments. It is highly unusual for a completely new type of satellite data to be ready for operational use as early as 16 months after launch.
Successful bias correction is an important part of optimising the use of satellite data. Over the last 12 months, ECMWF scientists, in close collaboration with engineers and scientists from DLR, DoRIT, ESA, KNMI and Météo-France, have made big strides in understanding Aeolus biases.
Details on forecast improvements resulting from the use of Aeolus data and on continuing efforts to improve the bias correction can be found in a previous news article. The main points are reproduced below.
Better forecasts
To determine the initial conditions for weather forecasts, Earth system observations are combined with short-range forecast information in a process called data assimilation.
An important question scientists ask of any new Earth system observations is the impact assimilating them has on the accuracy of those short-range forecasts as well as on medium- and longer-range forecasts.
Tests show that, when Aeolus data are assimilated, the short-range forecasts used in the data assimilation system are much improved: they are significantly closer to other wind, temperature and humidity observations (including aircraft, radiosonde and satellite data) than when Aeolus data are not assimilated. This is true especially in the southern hemisphere and the tropics.
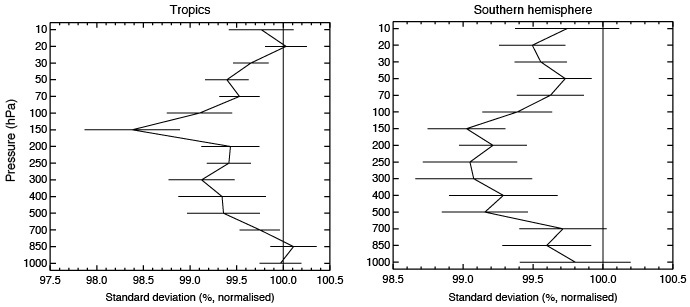
The charts show a reduction of up to 1.5% in differences between radiosonde, profiler and aircraft wind observations and short-range forecasts used in the data assimilation system as a result of assimilating Aeolus data in the tropics (left) and in the extratropical southern hemisphere (right). The differences without the assimilation of Aeolus data, expressed in terms of the standard deviation, are represented by the 100% mark. The horizontal lines represent 95% confidence intervals. The experiment covers the period of 2 August to 22 October 2019.
ECMWF’s main mission is to produce high-quality medium-range forecasts, between three to ten days ahead. A crucial question for the Centre’s scientists is thus what impact the assimilation of Aeolus data has on such forecasts.
Here, too, the results are very encouraging: there are clear improvements in weather forecasts throughout the medium range. The improvements can be found mainly in the tropics and the southern hemisphere, which are less well covered by conventional wind observations than the northern hemisphere.
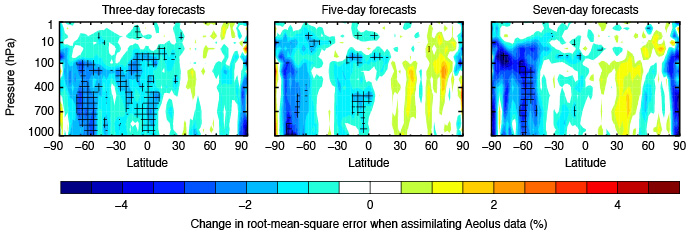
These plots show how the assimilation of bias-corrected Aeolus data (Rayleigh-clear and Mie-cloudy) reduces wind forecast errors (blue shading) in large parts of the southern hemisphere and the tropics throughout the troposphere and beyond (10 hPa corresponds to about 30 km altitude). In the northern hemisphere, forecasts improve mainly in the polar region. Cross-hatching indicates statistical significance at the 95% level. The experiment covers the period from 2 August to 18 October 2019.
Another important test is how the impact of assimilating Aeolus data compares to the impact of assimilating other Earth system observations.
“We have found the overall impact of Aeolus data on forecasts in the southern hemisphere and the tropics to be comparable to that of data from some other major components of the global observing system,” says ECMWF’s Mike Rennie, whose work on the data is funded by ESA.
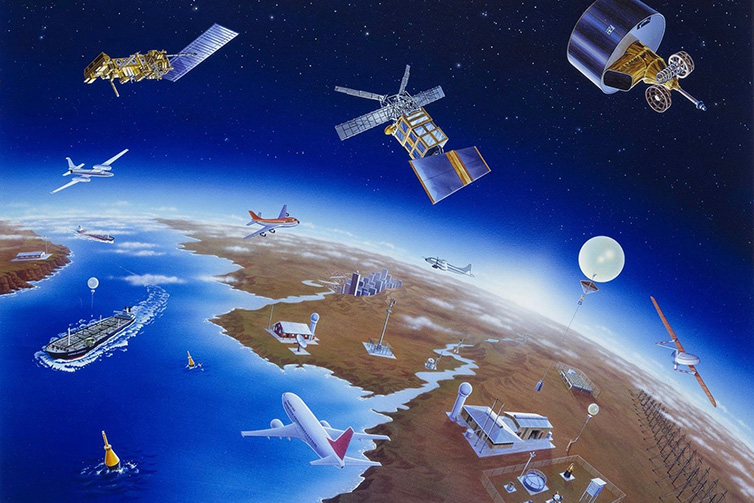
Aeolus wind data compare well with data from other parts of the global observing system, such as Atmospheric Motion Vectors, satellite-to-satellite radio occultation data, and satellite data from infrared sensors. (Image: WMO)
Improving the bias correction
In the northern hemisphere, the effect of assimilating Aeolus data on forecasts is more uneven than in the southern hemisphere.
“This is partly because much of the northern hemisphere is already relatively well observed,” says Lars Isaksen, the Head of the Actively Sensed Observations Group at ECMWF. “But we suspect that the complex pattern of Aeolus data biases in the northern hemisphere might also play a role,” he adds.
“We have been able to identify and correct some of these biases successfully, but there is scope for further improvements, due to a recent breakthrough.”
Patient scientific detective work carried out by Mike, in collaboration with other scientists, has shown that Aeolus biases are closely correlated with small variations in the temperature distribution across the large mirror used in the Aeolus instrument’s telescope.
“This finding will enable us to refine our bias correction, since those temperatures are measured in space and available in real time,” Mike says.
“Aeolus engineers and scientists are now investigating why such temperature differences cause large wind biases and if the mirror temperatures can be controlled better. A better understanding will be very valuable when designing and building a potential follow-on Aeolus instrument.”
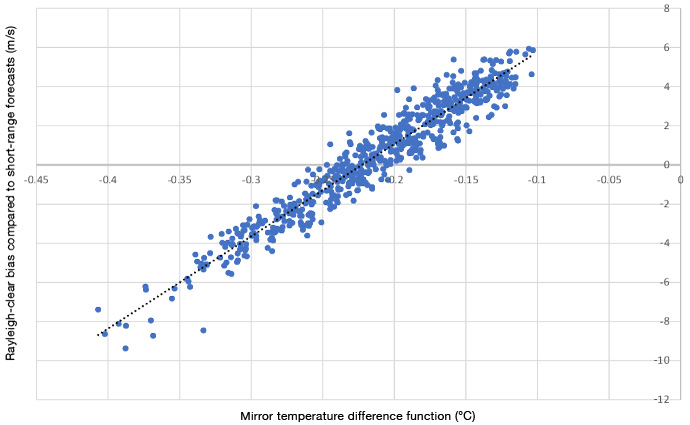
Biases in Aeolus wind data have been found to be closely correlated with tiny temperature variations across the 1.5 m diameter mirror which forms an important part of the Aeolus instrument. A 0.1°C change in temperature difference leads to a change in wind bias of around 5 m/s.
