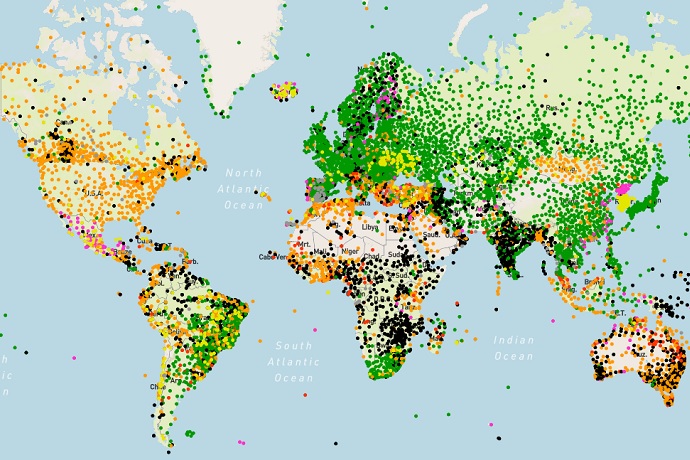

Six-hour WDQMS land-surface observation availability map on 8 March 2020 (green means fully reporting).
The World Meteorological Organization (WMO) and ECMWF launched a new web-based interface on 17 March 2020 to help monitor the availability and quality of global meteorological observations.
The new tool monitors the performance of WIGOS in-situ observing components and is part of the WIGOS Data Quality Monitoring System (WDQMS).
WDQMS monitors the availability and quality of land-based surface and upper-air observations, based on near-real-time monitoring information provided by four participating global numerical weather prediction (NWP) centres: the German national meteorological service (DWD), ECMWF, the Japan Meteorological Agency (JMA) and the US National Centers for Environmental Prediction (NCEP).
“For the first time, this new system is able to collect 6-hourly quality monitoring reports from the four WIGOS Monitoring Centres and store the data in the WDQMS database at ECMWF,” says ECMWF scientist Cristina Prates. “The data are then aggregated and the calculated statistics compared against performance thresholds.”
WDQMS works by comparing the number of observations received from the participating centres (i.e. the observations that were made available to the assimilation system at each Monitoring Centre) to those scheduled to be ingested according to the WMO’s OSCAR/Surface metadata repository for surface-based observations.
The system then flags up any discrepancies between what was scheduled and what was actually observed and highlights any issues.
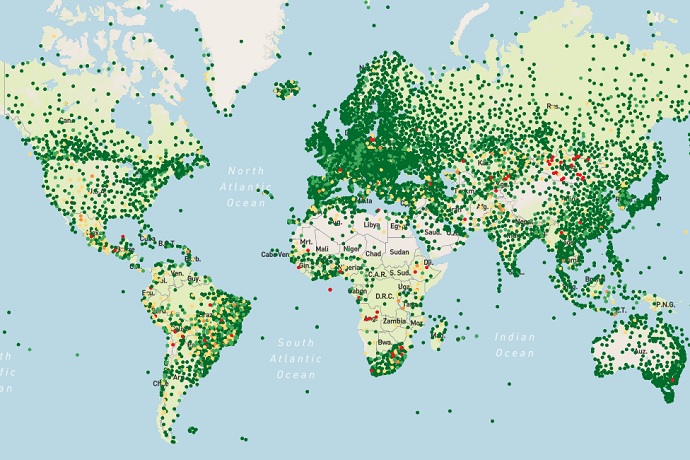
The quality monitoring is based on comparing quality statistics provided by the Monitoring Centres against observational requirements as defined in the OSCAR/Requirements repository.

Six-hour WDQMS land-surface observation quality map (surface pressure) on 9 March 2020 (green means the data are useful for NWP purposes).
Benefits
The system aggregates NWP monitoring information by station, time interval, observed variable and Monitoring Centre and generates availability and quality performance reports displayed as maps or time series. The temporal aggregation is then presented in three different formats: 6-hourly intervals, daily intervals and, in the future, monthly intervals.
An aggregation based on a 5-day moving average across the Monitoring Centres is also available to warn staff at WMO Regional WIGOS Centres (RWCs) of potential observational issues. The RWCs assess whether any issues highlighted by system should be formally raised as incidents with data providers.
“WDQMS has the potential to bring far-reaching benefits for the World Meteorological Organization’s management of in-situ components of WIGOS in relation to the quality of observations and associated station metadata,” Cristina says.
“The NWP community will benefit from a better-quality network and near-real-time access to comparable quality monitoring data from multiple global NWP centres. This can be used as a diagnostic tool to support investigations of statistical anomalies, particularly to disentangle observation errors from model errors.”
The web tool gives global NWP centres an opportunity to enhance their monitoring capabilities by comparing their data coverage and quality statistics with those of other NWP centres. It also enables all national meteorological services to receive feedback in near real time on the usage and quality of their observations.
Future developments of the tool include the production of monthly performance reports for each observed quantity at each WMO land station covering the performance indicators of availability, quality and timeliness.
There are also plans to extend the tool to other components of WIGOS, including marine and aircraft observations.
