
ECMWF is on a mission to make its data available to more people. Sylvie Lamy-Thépaut combines weather forecasting expertise with computing knowledge to achieve this.
After studying meteorology at l'École nationale de la météorologie in Toulouse (France) in the 1980s, she worked as a weather forecaster for a year. But she found that she was more interested in making the forecast data accessible to forecasters through visualisation on graphical computers, a technology just emerging at the time.
She did a Master's in computer science while she was employed by Météo-France, with some time spent at ECMWF to help develop the first version of an interactive workstation for its researchers called Metview.
Since 2002, Sylvie has worked directly for ECMWF, both on Metview and the meteorological plotting software Magics. As head of the web development team, since 2012 she has gradually opened ECMWF’s data to a wider audience, modernising ECMWF’s web infrastructure as she went along.
“We are currently in the process of making a subset of our data available in real time and fixed resolution to anyone interested in them,” she says. “This principle is associated with some technical challenges which we are working to address.”

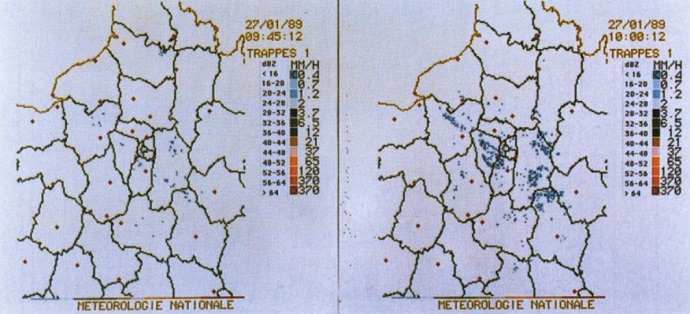
At the beginning of her career, Sylvie worked on a system of visualisation for Météo-France. These plots show precipitation amounts in mm per hour as observed by the radar located at Trappes southwest of Paris.
ecCharts
One of Sylvie’s first missions as head of the web development team was to work on an interactive web application for ECMWF’s Member and Co-operating States and other customers, showing forecasting charts. This application is called ecCharts and uses Magics.
“A key activity was to make Magics sufficiently fast to reliably produce forecasting charts as selected by users,” Sylvie explains.
“The challenge is that ecCharts is updated every 12 hours with the latest forecasting information in the native resolution. This means that 1 terabyte of data needs to be processed in a short amount of time.”

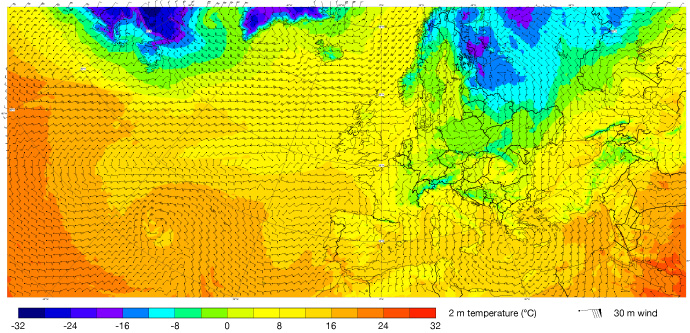
This ecCharts image shows the predicted 2 m temperature and 30 m wind at 12 UTC on 11 January 2022, in a forecast from 00 UTC on 7 January 2022.
ecCharts allows users to select any of more than 250 parameters to look at. They can zoom and pan on any area of interest. They can also do some computations, such as the probability of snow or wind gusts above a certain threshold.
While forecasters would generally opt for ecCharts, researchers are more likely to consult the data in its raw format in the data portal. They can then feed the data into their own models or apply computations to it as required.
ecCharts and full access to ECMWF’s database are available only to Member and Co-operating States and other customers. More recently there has been a move towards open data.
Towards open data
Today ECMWF makes two sets of forecasts and data available: one that includes the complete current forecast and full access to the archive for professional users, and another one containing open charts and data for the general public.
‘Open charts’ have been available since October 2020. They provide access to ECMWF’s current forecasts, but only in graphical form. Users cannot zoom and pan but can select one of 30 predefined areas across the globe to look at.

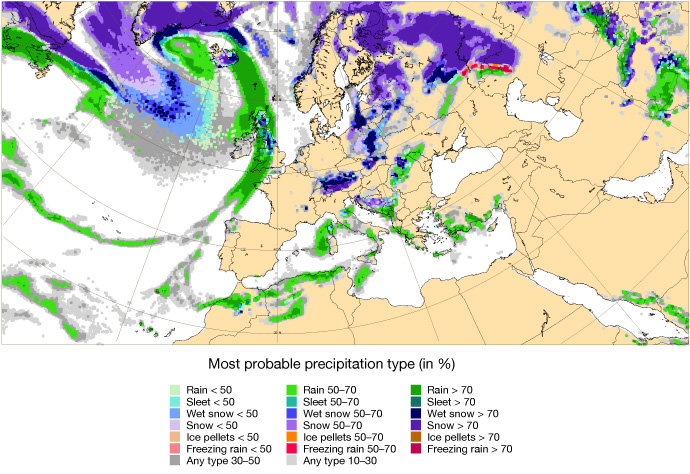
One of the many forecast charts available as open charts is the precipitation type forecast, shown here for the region of Europe for 09 UTC on 6 January with a lead time of 9 hours.
Since November 2021, more open chart forecast products have been made available, and six-hour updates are provided compared to 12-hour updates before.
It is now also possible to view several products in parallel and interact with them. “This ‘ChartSet’ option is a nice way to see different parameters over the same area and for the same forecasting time,” Sylvie says. “We are constantly trying to improve the application’s performance and the user experience.”

From the open chart selection page, different forecasts can now be viewed side by side for the same area and forecasting time.
From 25 January, more data will become available to the general public in the form of ‘open data’. “A big subset of our data will be made available in a timely manner at a fixed resolution,” Sylvie explains.
“One of the challenges I have to deal with is to make the data findable by users. We have so many data that it can be difficult for users to discover what we have.”
One way of doing this will be to provide links to Jupyter notebooks from some of the charts accessible in open charts. The notebooks will explain how the user can access ECMWF data, but also which process has been applied and how they can easily be visualised.
Migration to Bologna
Another task Sylvie has been involved in is the migration of all computing work from Reading, UK, to ECMWF’s new high-performance computing facility in Bologna, Italy.
A central part has been to migrate the web applications to Kubernetes technology, which makes it possible to deploy them on a cloud infrastructure, giving them the required scaling flexibility.
“Key questions I have to ask myself are: what might users expect of our forecasts, and how can I get the required information to them to help them? The answers determine what needs to be done to improve the experience of all our users.”
