Visualisation in Meteorology Week was held from 28 September to 2 October 2015
The visual representation of observations and numerical forecasts are essential for the success of any NWP centre. They help researchers to understand the processes and formulate new ideas, and allow forecast users to easily grasp the large amount of data generated by numerical models. Developments over the last decades have taken visualisations from simple plots to interactive web displays. This has enabled new ways of looking at and understanding meteorological data.
To celebrate the achievements of recent years, ECMWF co-hosted a series of meetings to revisit the state-of-the-art and show the possibilities for the future. The meetings' language is English.
15th Workshop on Meteorological Operational Systems (MOS)
The biennial Workshop on Meteorological Operational Systems will be the fifteenth in the series. The workshop will review recent developments and requirements in data management and visualisation.
This year there will be a special focus on visualisation of operational products and services. The workshop will review upgrade cycles in meteorological institutes, services and companies aiming at utilising visualisation to develop or improve forecast products. These change processes influence the development of meteorological operational systems, data management and archive systems, meteorological visualisation on workstations and web services.
26th European Working Group on Operational Meteorological Workstations (EGOWS)
EGOWS was founded in 1990 as an informal forum for people working in the development field of operational meteorological workstations. The annual EGOWS meeting offers an excellent platform for exchanging information and furthering co-operation among the experts from European NMS's, ECMWF and other institutes.
The meeting will consist of presentations, software demonstrations and working group discussions. Talks and demonstrations will focus on the latest developments and will give participants the opportunity to demonstrate their current operational systems. Working groups are intended for discussions on special subjects. The EGOWS meeting focuses on more than IT technology - it can also encompass broader aspects such as designing systems and interacting with users.
Details of previous EGOWS meetings can be found here: http://en.wikipedia.org/wiki/EGOWS
Group photo from EGOWS 2010 held at ECMWF
Exhibition of visualisation systems
Traditionally one part of the EGOWS and MOS meetings is an exhibition session of visualisation systems. This year these exhibitions will be combined and will be open to any participants to give the opportunity to show users the recent years' advances in this area.
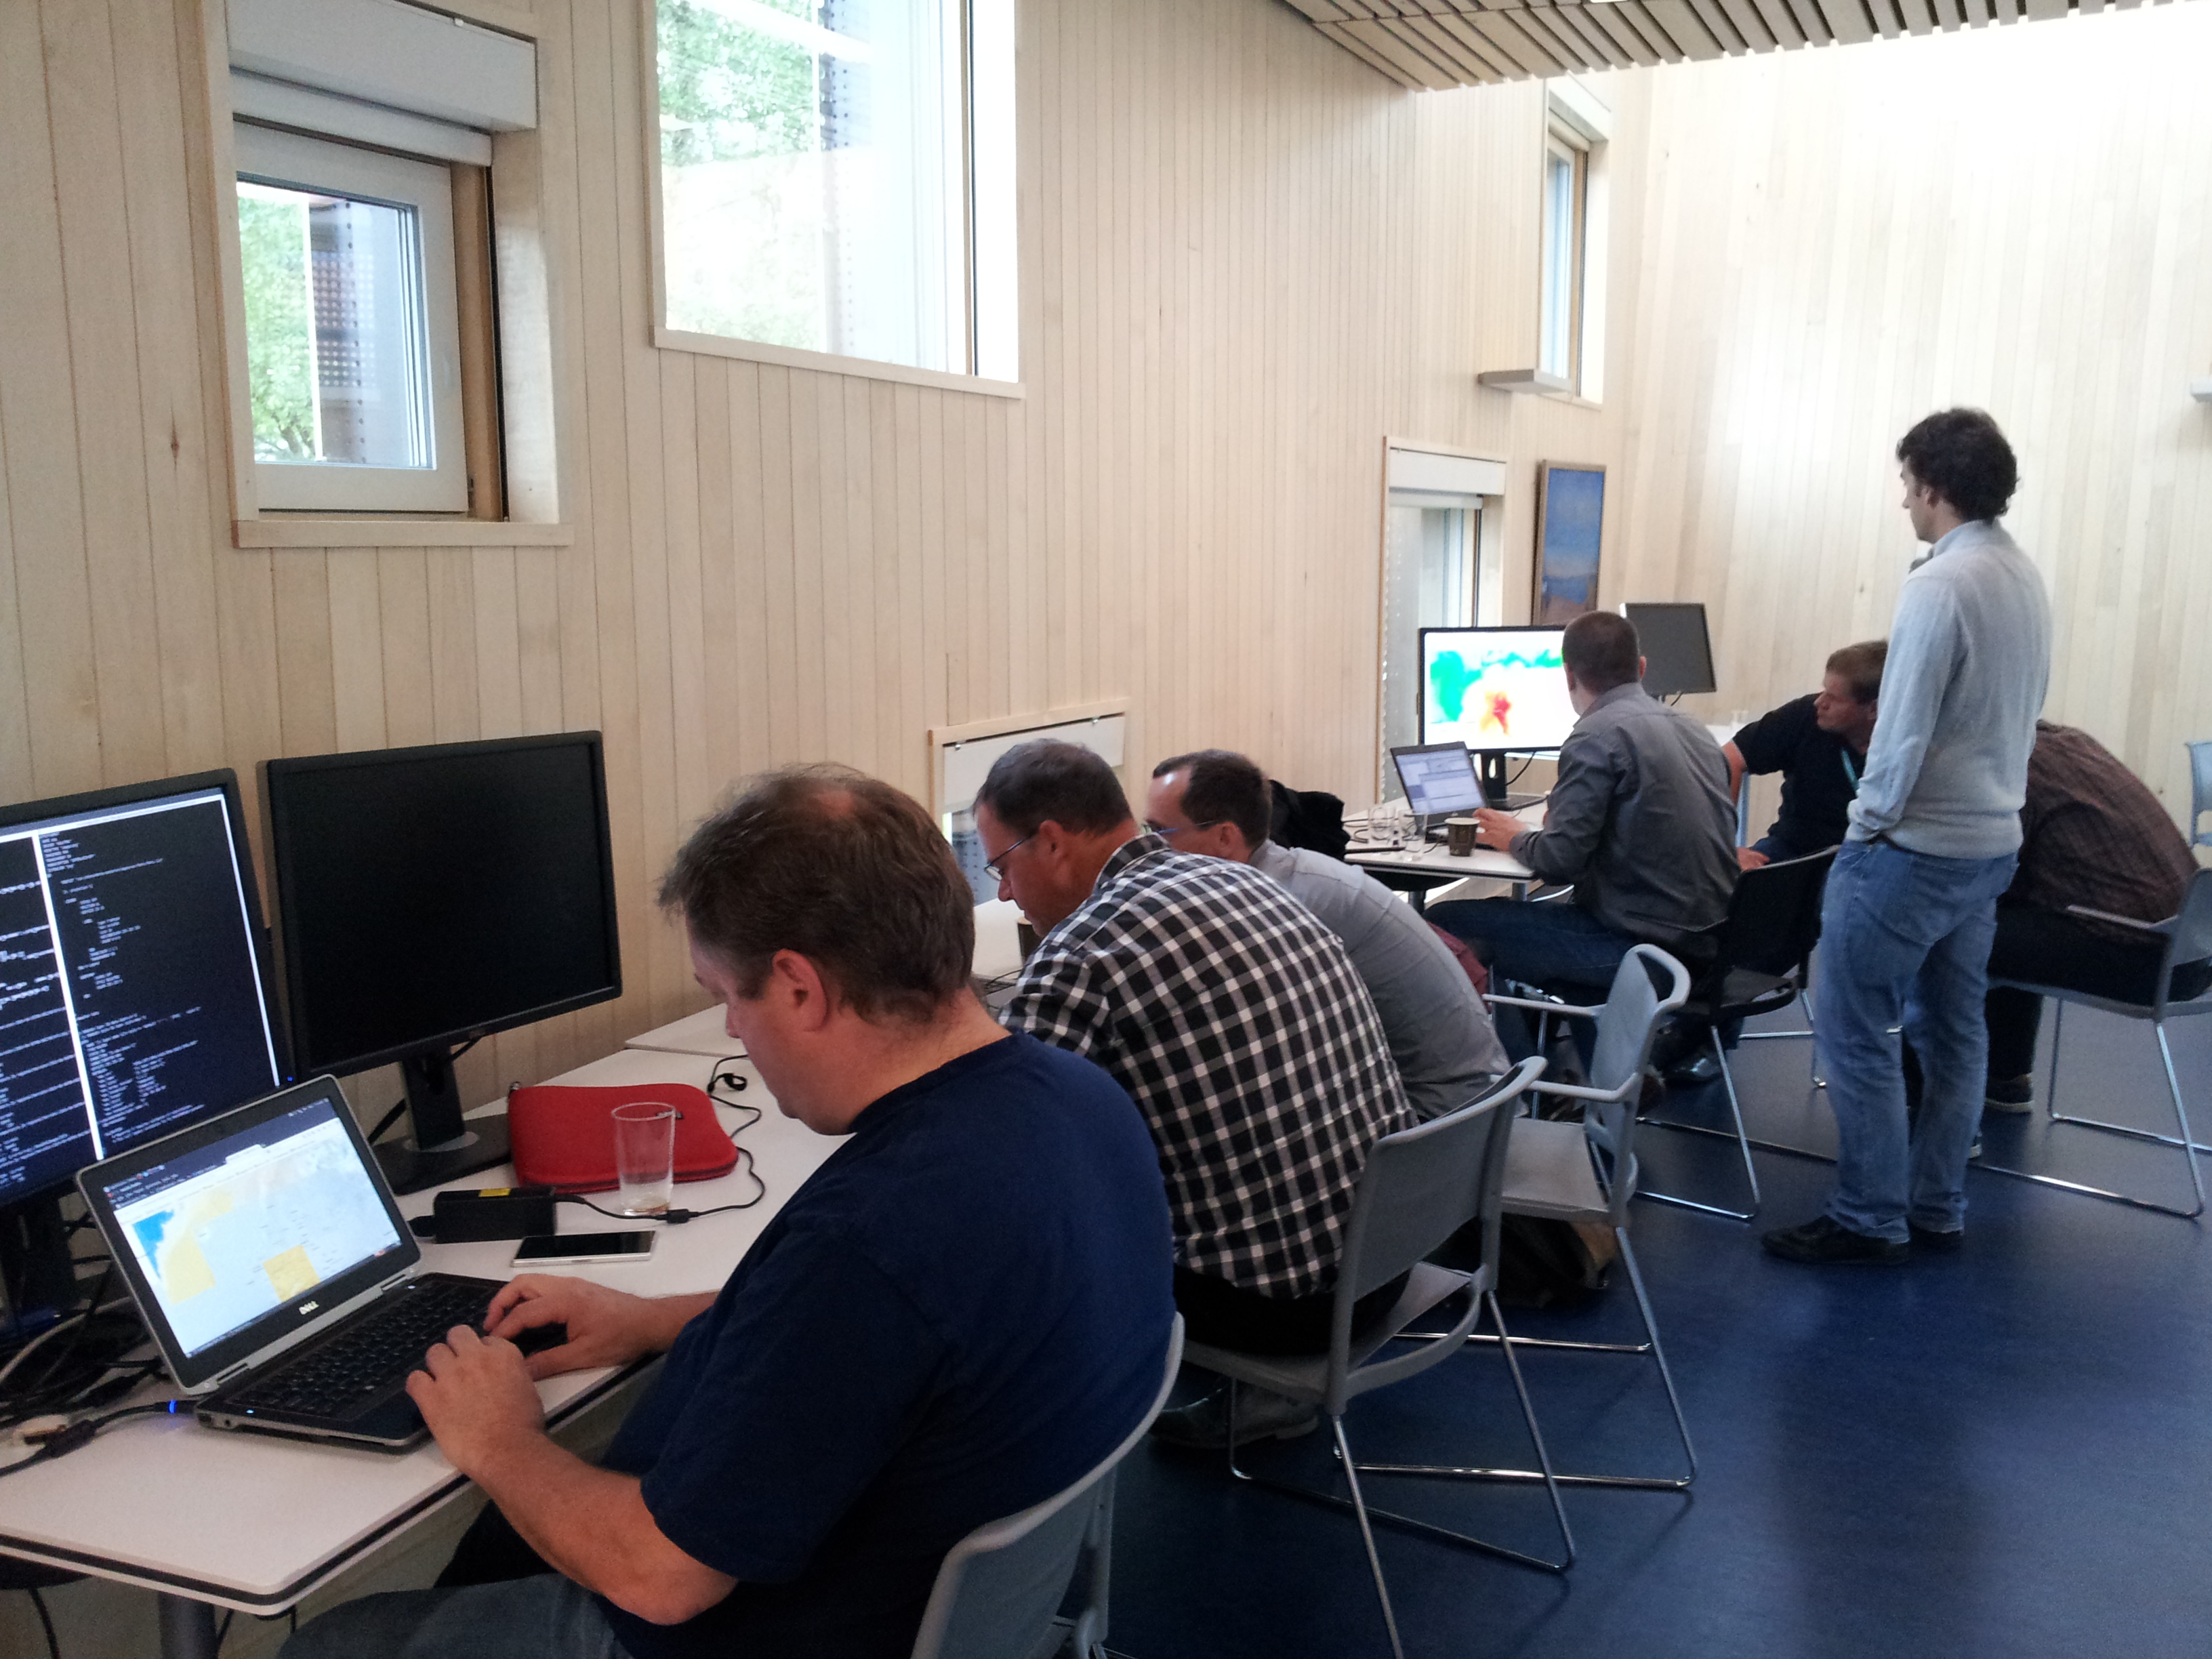
Photos from the last exhibitions at MOS 2013 (top) and EGOWS 2014 (bottom)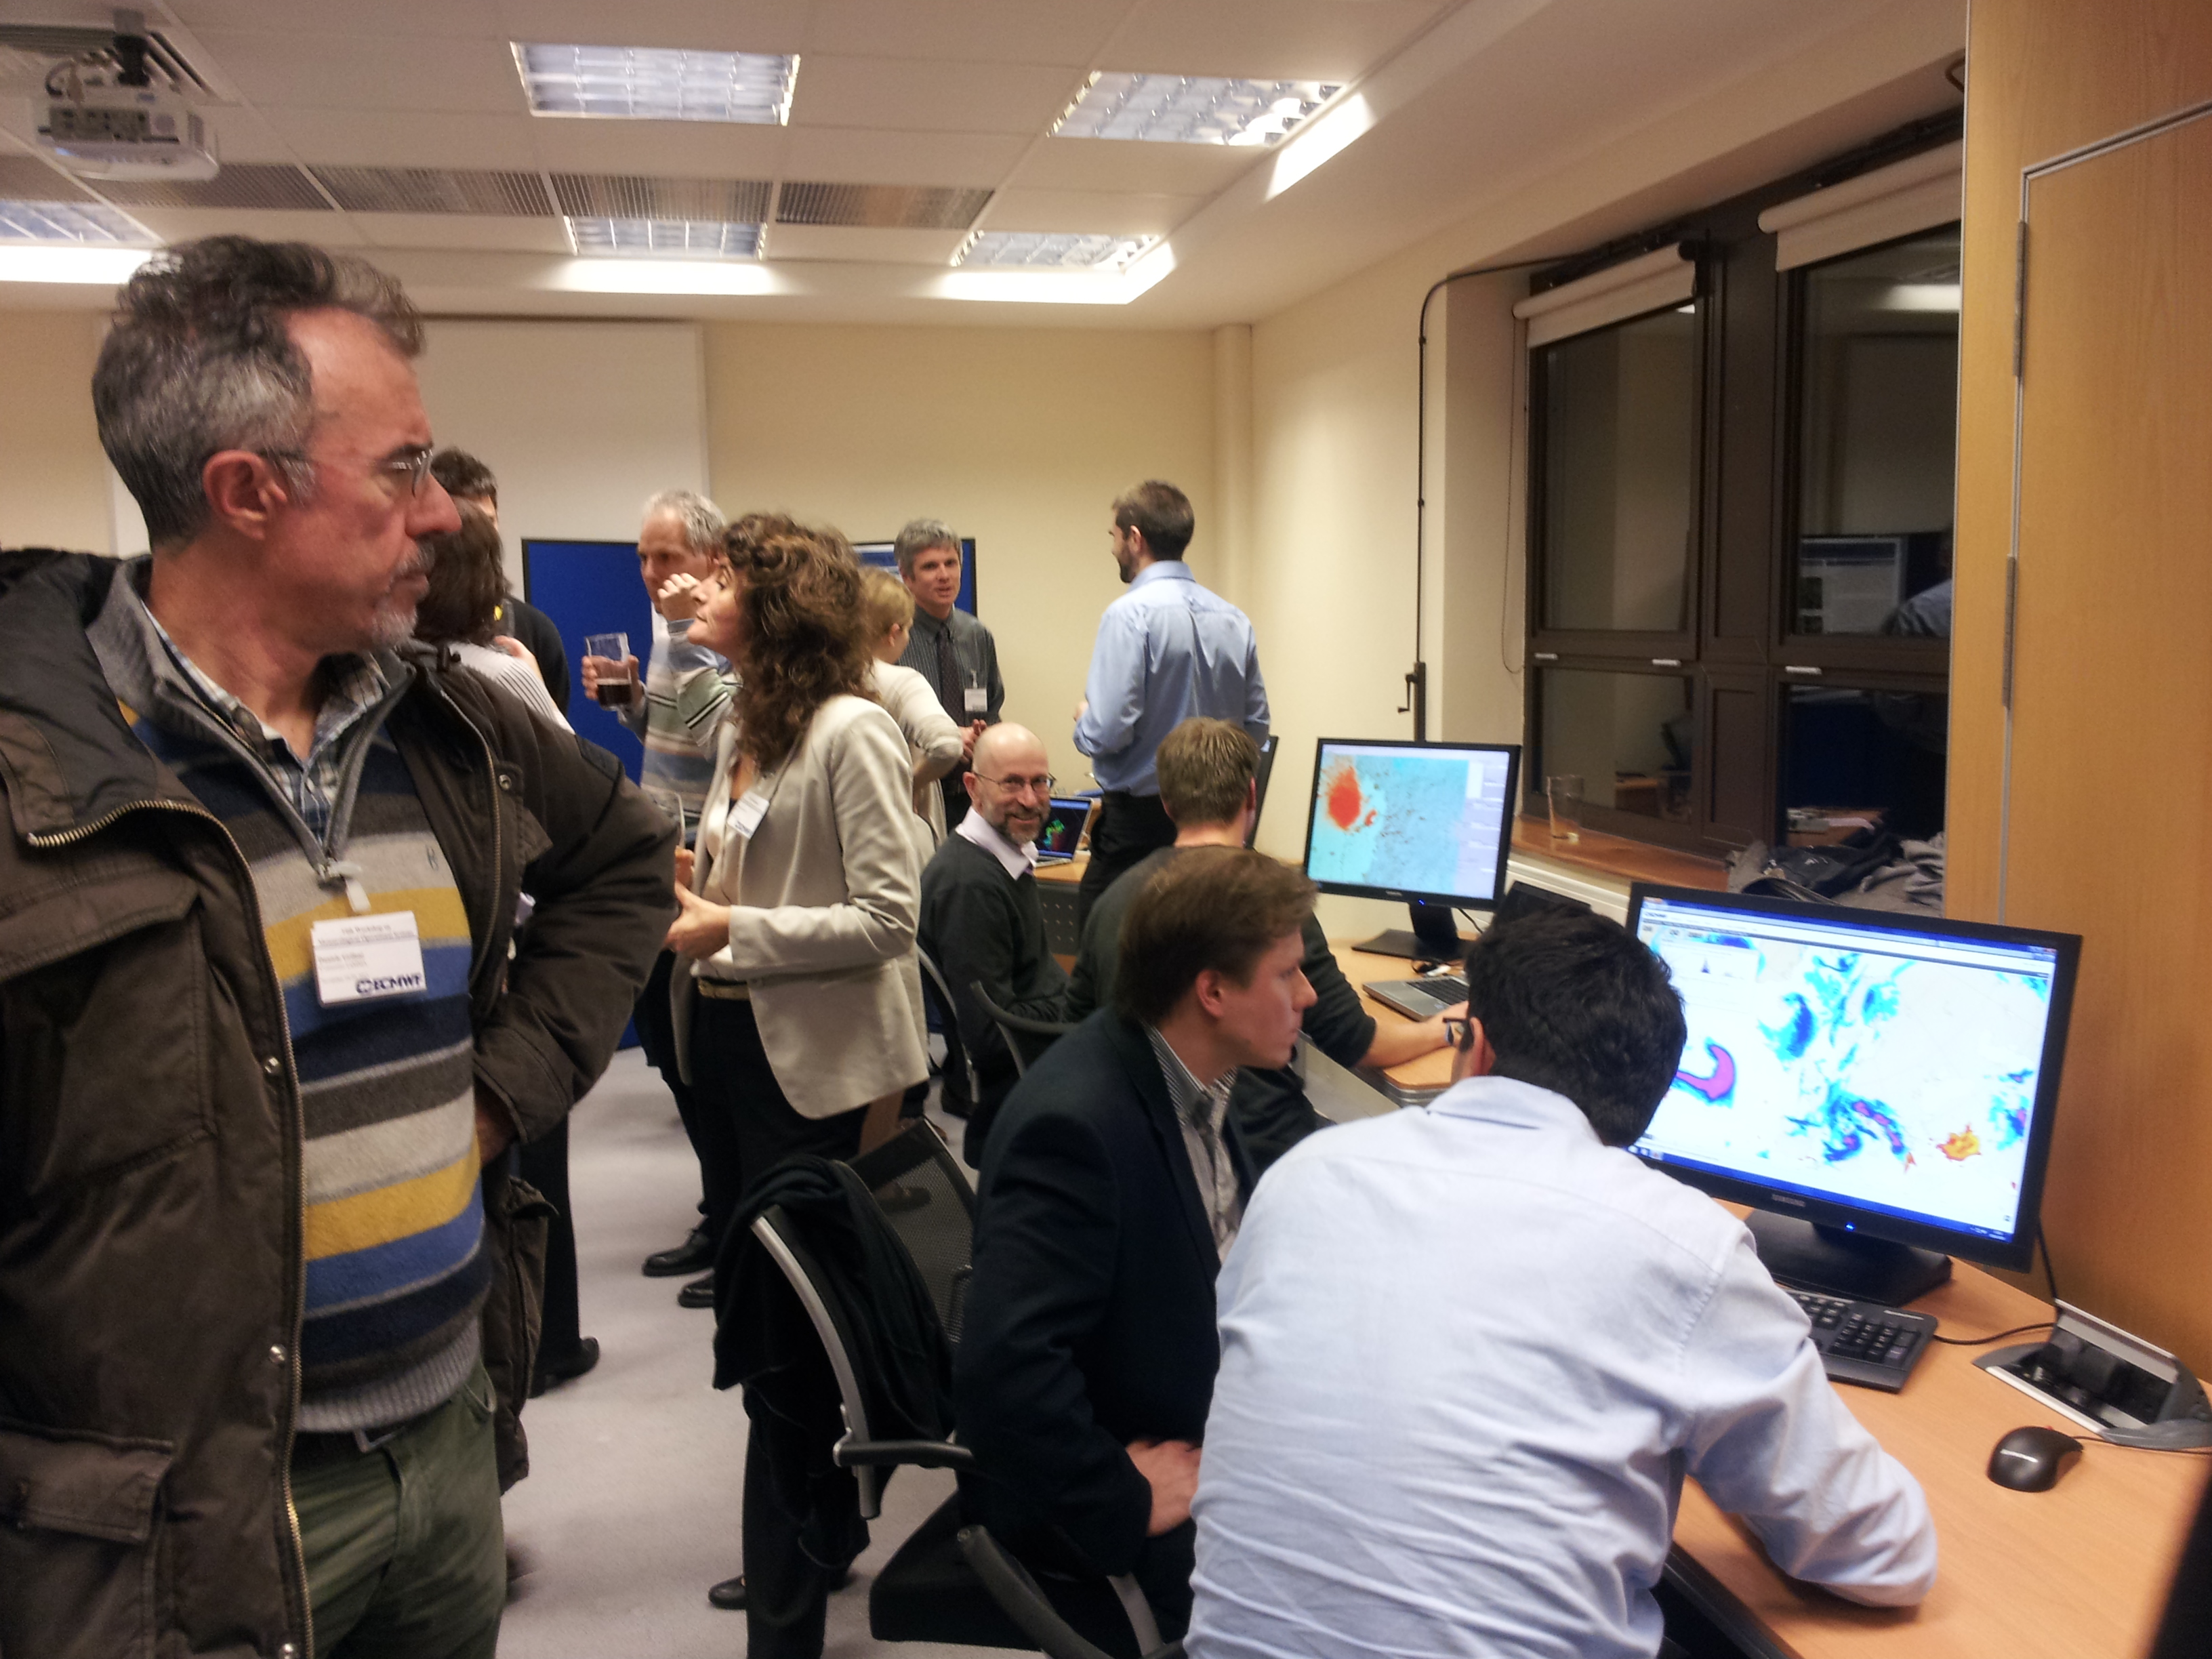
Royal Meteorological Society - Seminar on Visualisation in meteorology
http://www.rmets.org/events/visualisation-meteorological-data
MetOcean DWG OGC plug-fest
OGC web standards originated from the GIS community and are increasingly used within operational meteorology. Especially the Web Map Service (WMS) allows the servicing of weather maps to forecaster workstations or even hand-held clients. Increasingly the Web Coverage Service (WCS) is also gaining popularity for the retrieval of data.
ECMWF will host a plug-fest in which participant clients will try to request maps and data from various WMS and WCS services. The aim is to show powerful examples of the usefulness of these services and give input to the MetOcean DWG in which areas standards or best practices need to be improved.
Everyone is invited to join with their servers and clients for WMS and WCS services or to simply observe the plug fest.
Time-line of events:
- Q2 2015 - General announce + request for scenarios
- Q3 2015 - Announcement of scenario/use case to be covered
- August 2015 - First pre-plug fest session
- 2nd Oct 2015 - plug fest
Presentations
Monday 28 September
|
The role of visualisation at ECMWF |
|
| Visualisation of confidence in weather forecasts: ECMWF's users current and future plans for displaying valuable information produced by ECMWF ensemble forecasting system Anna Ghelli (ECMWF) |
|
| Update on the work of MetOcean DWG Chris Little (Met Office/OGC) |
|
| Products, weather and sea state forecasts provided by the CPTEC/INPE for 2016 Olympics José Antonio Aravéquia (CPTEC/INPE) |
|
| Experiences and challenges in the development of the JASMIN cloud service for the environmental science community Philip Kershaw (STFC/RAL) |
|
| Real-time collaboration in web based visualisation Ben Calton (Plymouth Marine Laboratory) |
|
| Visualisation in Copernicus Atmosphere Monitoring Service Miha Razinger (ECMWF) |
|
| Visualisation of global floods - The Global Flood Awareness Florian Pappenberger (ECMWF) |
|
| Machine Learning without a PhD in statistics Andrew Fryer (Microsoft Limited) |
|
| The new DWD forecast system, based on ICON and COSMO-DE Thomas Hanisch (DWD) |
|
| MetOcean Data Server Brainstorm Roope Tervo (FMI) |
|
| EUMETView - the EUMETSAT Image Gallery based on Web Map Services Guillaume Aubert (EUMETSAT) |
|
| ecFlowUI - visualising complex work flows Sándor Kertész (ECMWF) |
Tuesday 29 September
|
Update on ECMWF's new BUFR decoder ecCodes |
|
| Migration from Traditional Alphanumeric Codes (TAC) to Table Driven Code Forms (TDCF) at the German Weather Service Daniel Lee (DWD) |
|
| CDO - Climate Data Operators Ralf Mueller (MPI) |
|
| MIR - ECMWF's new interpolation package Tiago Quintino (ECMWF) |
|
| Agile retrieval of Big Data with EarthServer Peter Baumann (Jacobs University and rasdaman GmbH) |
|
| Interactive 3D visualization of ECMWF ensemble weather predictions Marc Rautenhaus (TU Muenchen) |
|
| Do location-specific forecasts pose a new challenge for communicating uncertainty? Andrew Charlton-Perez (University of Reading) |
|
| How users drive us to make the complex understandable on Yr Ingrid Støver Jensen (Norwegian Broadcasting Corporation - NRK) |
|
| Data visualisation for un-engaged audiences Adam Nieman (Carbon Visuals) |
|
| What is EGOWS? 25 years of workstation development Stephan Siemen (ECMWF) |
|
| Synergie-Next: Change processes and latest developments Lisa Marchand and Hugo Vandeputte (Météo-France) |
|
| Where is Diana? Alexander Buerger (Met Norway) |
|
| Web based NWP model management Michal Weis (IBL) |
Wednesday 30 September
|
Data analysis and visualisation with Metview |
|
|
The NinJo user story |
|
|
Smartmet II based warning system at the FMI |
|
|
Operational visualization process and and tools of NWP output in KMA |
|
|
Iris: A Python package for the analysis and visualisation of meteorological data |
|
|
Visualize the high resolution model output with 3-D Adaptive Resolution feature in the IDV |
|
|
A one-stop service hub integrating essential weather and geophysical information on a GIS platform |
|
|
GIS Applications in National Meteorological operational system |
|
|
ECMWF forecasts on the web - the ecCharts success story |
|
| Seminar on visualisation in meteorology - welcome Bob Lunnon (Royal Meteorological Society) |
|
|
The role of visualisation in meteorology |
|
| The visualisation of ManUniCast Jonathan Fairman (University of Manchester) |
|
| Making better scientific figures Doug McNeall (Met Office) |
|
| Visualisation at the Met Office Neil Armstrong (Met Office) |
|
| A short personal history of weather visualisation Chris Little (Met Office) |
Thursday 1 October
|
20 years of success for Metview's modular architecture |
|
| ECMWF's web infrastructure Carlos Valiente (ECMWF) |
|
| Significant increases in model data volumes and other challenges for a meteorological visualization platform Marcus Werner (DWD) |
|
| A forecast for CPU cores, memory and disks Michal Weis and Jozef Matula (IBL) |
|
| Code contribution for ECMWF software and exploring possibilities for co-operation between developers Stephan Siemen (ECMWF) |
|
| Changes to ECMWF's grids in 2016 Paul Dando (ECMWF) |
|
| Modernisation of Forecasting Process Programme Angel Alcázar (AEMET) |
|
| Interoperability through the use of OGC standards Peter Trevelyan (Met Office) |
|
| How to integrate processing functionality into WMS Jürgen Seib (DWD) |
Contact
Programme Co-ordinator: Stephan Siemen
Event Adminsitration: Karen Clarke