Verification of forecasts against surface observations from SYNOP stations is an important part of monitoring progress in numerical weather prediction systems such as ECMWF’s Integrated Forecasting System (IFS). Parameters observed at such stations typically include 2-metre temperature and humidity, 10-metre wind, total cloud cover and precipitation. In addition to SYNOP observations, which are distributed via the Global Telecommunication System (GTS), many countries maintain higher-density national observational networks which provide data that is not generally available on the GTS. In 2014 ECMWF started an initiative to collect such observations from its Member and Co-operating States for use in model evaluation. Based on the experience gained in previous efforts (Csima & Ghelli, 2008), it was decided to use a unified data format for the data transfer in order to facilitate its long-term maintenance.
Skill Scores
SEDI
The Symmetric Extremal Dependence Index (SEDI) is a skill score appropriate for extreme events. It provides meaningful results in the case of rare events where the hit rate and false alarm rate decrease towards zero. It is defined for a binary event and thus requires a threshold to be set.
TS and ETS
The Threat Score (TS) is a skill score for binary events and requires a threshold to be set. It is defined as the ratio of the number of hits to the sum of hits, false alarms and misses. The Equitable Threat Score (ETS) is an adjusted Threat Score in which the number of hits that would be expected to occur by chance alone is deducted from the number of hits.
Data from additional stations improves the sampling of the quantity to be evaluated. First results obtained from the use of precipitation data in forecast evaluation show that this leads to reduced noise in time series of forecast skill. It also increases confidence in comparisons between operational and experimental model cycles, which are necessarily based on a limited verification period. In the case of precipitation and wind, the fact that less frequent, higher-intensity events are of special interest adds to the value of a dense observation network.
Collection of high-density observations in Europe
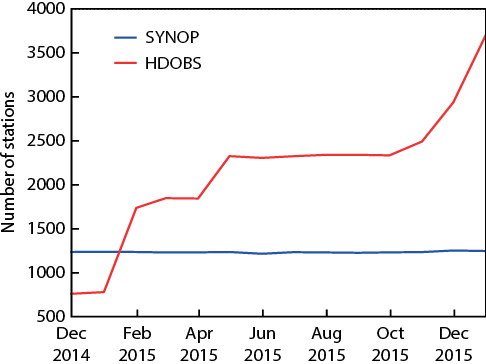
As of February 2016, ECMWF receives high-density observations (HDOBS) of precipitation on a regular basis from a number of Member and Co-operating States. Some countries additionally provide observations of surface parameters such as 10-metre wind speed and 2-metre temperature. The temporal aggregation of the precipitation data varies between 1-hourly and 24-hourly. For verification purposes it is being aggregated into 6-hour and 24-hour totals. The ratio of the number of HDOBS to SYNOP stations varies between countries and typically lies between 2/1 and 3/1. Figure 1 shows how the total number of HDOBS stations included in the initiative has increased considerably between November 2014 and January 2016.
Reduction of verification uncertainty
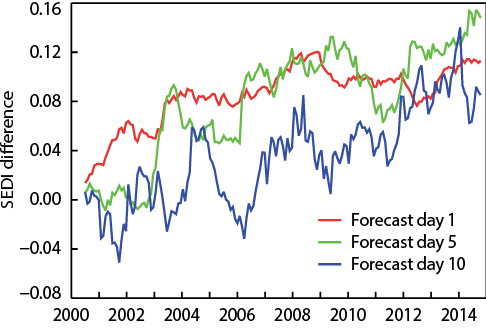
The skill in predicting heavy precipitation is important for many forecast users. As documented by Forbes et al. (2015), heavy precipitation forecasts have improved over the last decade due to upgrades to the IFS, in particular the representation of cloud and precipitation physics. However, when high thresholds of precipitation are evaluated, the detection of longer-term trends is made difficult by the noise associated with small sample sizes and considerable inter-annual variability. This is especially true for longer lead times, where individual events are captured less consistently. Figure 2 illustrates this for the difference in the Symmetric Extremal Dependence Index (SEDI) (Box A) between the high-resolution forecast (HRES) and forecasts from the ERA-Interim reanalysis at forecast days 1, 5, and 10, based on the verification of 24-hour precipitation against SYNOP for the European domain. Although only a moderately high threshold of 20 mm is used, and 12-month running averages are shown, the scores exhibit considerable inter-annual variability at forecast days 5 and 10. This makes it more difficult to quantify the effect of model improvements at these time ranges.
The time period covered by the HDOBS dataset is not yet long enough to provide improved estimates of long-term skill evolution. However, it also has a positive effect on the consistency of mean scores averaged over a limited period of time. Figure 3 shows the Equitable Threat Score (ETS) (Box A) of the operational high-resolution forecast (HRES) evaluated over a 13-month period using SYNOP and HDOBS. Although the two regions shown (Norway and Turkey) have quite different precipitation climates and processes, some aspects of the results are similar. In both areas, a reduction of noise in the curves can be seen for the highest threshold of 50 mm. For 10 and 20 mm, the verification against HDOBS largely confirms the dependence of skill on forecast range obtained from SYNOP. ETS values for 10 and 20 mm are surprisingly similar between the two regions in the medium forecast range around day 5 while in the short range the scores are somewhat higher for Norway. At 50 mm, there is a stronger drop in skill from day 1 to day 2 in the more convectively active area of Turkey compared to Norway, where the heaviest precipitation events are mostly due to orographic upslope effects, which are associated with higher predictability.

Upscaling of observations
The mismatch in scale between the model grid and the point-like rain gauge observations can affect the quality of precipitation scores depending on how spatially representative the observations are. To eliminate this mismatch, observations have to be upscaled to the model grid. Göber et al. (2008) showed that without such upscaling a ‘perfect’ model, which in their case was constructed from grid-box averages of high-density observations, scored an Equitable Threat Score of only 0.5 for precipitation thresholds of 30 mm a day and higher, rather than the best possible value 1.0.
In practice, only part of the subgrid-scale variability of the precipitation field is known from observations, and the quality of the upscaling depends on the number of stations available within each grid box. From operational high-resolution (1 km) radar-plus-raingauge precipitation analyses provided by the Central Institute for Meteorology and Geodynamics (ZAMG, Austria) it was found that, at the previous HRES grid spacing of 16 km (reduced to 9 km in March 2016), having three stations instead of one per grid box reduces the effect of the scale mismatch on scores by more than a half. Even with high-density observations, the fraction of grid boxes on the IFS model grid which fulfil this condition is very small. For the area of Germany, for example, only 0.5% of grid boxes in the 16 km grid contain three or more stations. However, if the scale is increased to three times the grid spacing (about 50 km), this number increases to 54% (compared to 13% for SYNOP). Such upscaling, not just of observations but also of the forecast, is important to ensure that the verified quantity corresponds to the smallest scales actually resolved by the model.
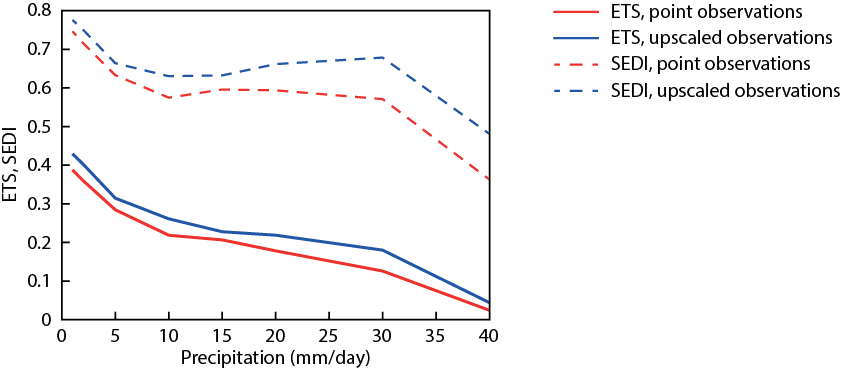
Figure 4 shows how skill scores such as the Equitable Threat Score and the Symmetric Extremal Dependence Index increase when determined by verification against upscaled observations, as compared to the use of point values. The upscaling was performed by taking an average of all the observations in a grid box. Up to about 20 mm the increase in skill is due to reductions in both the number of missed events and false alarms. At higher thresholds, it is mainly due to fewer missed events. The upscaling reduces the influence on scores of the most localised events, where heavy precipitation is observed in one location but not at neighbouring stations. It increases the number of light to moderate precipitation events and reduces the number of heavy precipitation events. This effect increases with precipitation amount. For example, the number of events exceeding 20 mm is reduced by about 20%, the number of events exceeding 40 mm by about 50%.
Another way of addressing the scale disparity between precipitation forecasts and rain gauge observations has recently been proposed by Tim Hewson and Florian Pappenberger (personal communication) at ECMWF. They have shown that the estimation of point rainfall probabilities from the ensemble forecast can be improved by taking into account situation-dependent (e.g. convective/non-convective) subgrid-scale variability. Work at ECMWF on situation-dependent verification and post-processing is currently ongoing and may be extended to other parameters, such as 2-metre temperature, to elucidate situation-dependent model biases.
Case studies
High-density observations aid in the daily monitoring of forecast performance for high-impact weather. They provide improved estimates of the areal precipitation distribution in the most heavily affected areas. Apart from deep convection, strong gradients in the precipitation field often result from orographic effects, two examples of which are briefly described below.
Norway – September 2015
In the first two days of September 2015, the south of Norway experienced heavy precipitation associated with a cut-off low in the upper-level flow which became quasi-stationary over the North Sea. The centre of the associated surface low moved slowly over the course of several days from Denmark into southern Norway. The region had already experienced heavy rainfall a few days prior to the event and the ground was therefore pre-conditioned to produce a strong hydrological response. The event led to widespread flooding, landslides, the closure of roads and rail lines, and the closure of a runway at Oslo airport. The highest precipitation amounts were observed inland, some distance from the southeast-facing coast, with a maximum of 182 mm in 48 hours. The European Flood Awareness System (EFAS) run at ECMWF produced a number of flash-flood warnings in the area, as documented in the EFAS Bulletin August–September 2015, downloadable from the EFAS website (www.efas.eu/).
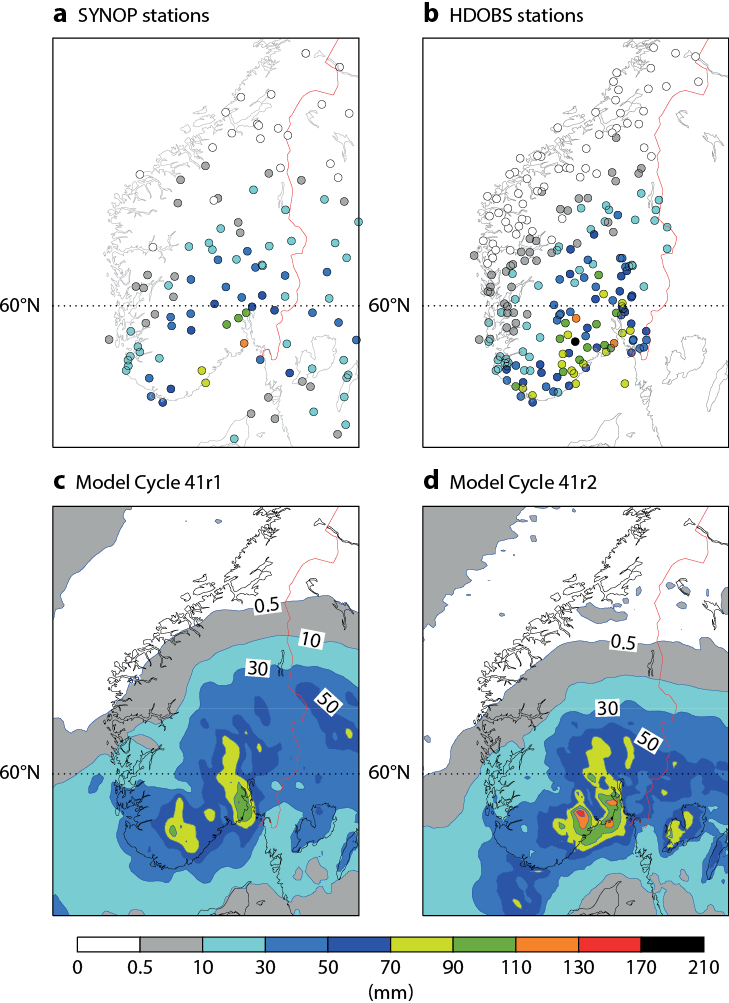
Figure 5 shows 48-hour totals from 0600 UTC on 1 September to 0600 UTC on 3 September 2015 as represented by SYNOP and SYNOP+HDOBS data, and corresponding HRES forecasts for a lead time of 3 days (30 to 78-hour forecast) from the then operational model cycle (41r1) and the then pre-operational model cycle (41r2). In the area shown there are 223 Norwegian HDOBS stations available compared with 118 SYNOP ones. The HDOBS stations provide a substantially better spatial representation of the most heavily affected areas, in particular the two north–south oriented bands of heavy precipitation, which are also present in the forecasts.
Switzerland – November 2015
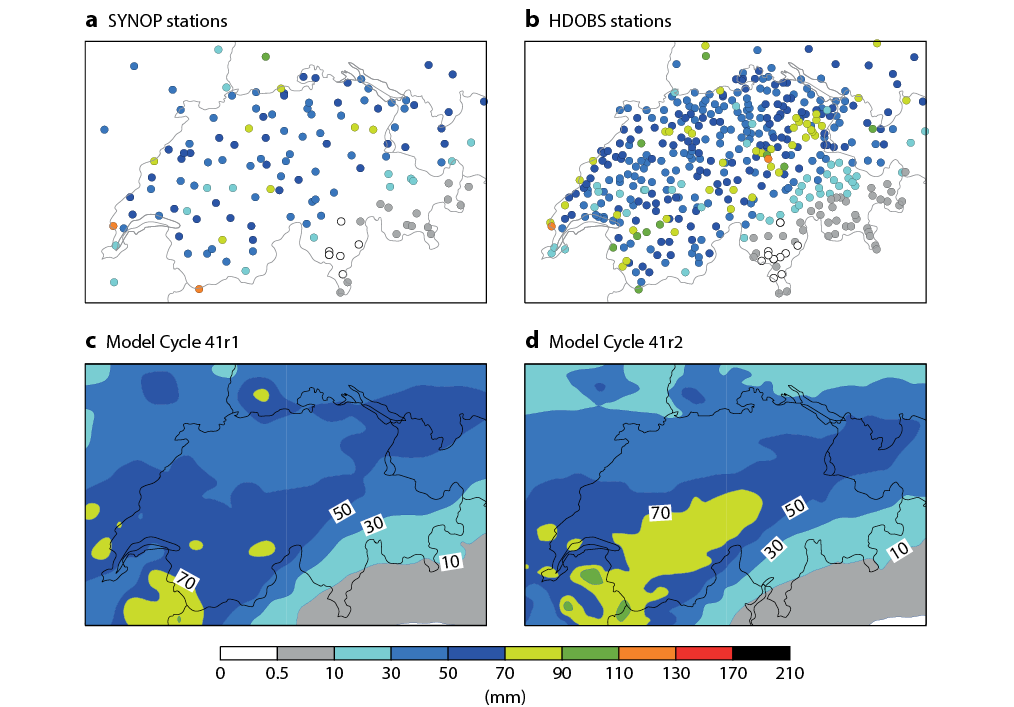
A cold front which moved across Switzerland from the north on 20 and 21 November 2015 brought the first major snowfall of the season in the area. The snowfall line descended from 2700 m to 700 m during the course of the event, and no significant flooding was reported even though heavy precipitation was recorded in much of Switzerland outside the orographically sheltered south-east. Of the 408 Swiss HDOBS stations, 167 stations reported totals over 50 mm. One station in the Jura mountains recorded 116 mm in 24 hours. Figure 6 shows 24-hour totals from 0600 UTC on 20 November 2015 to 0600 UTC on 21 November 2015 as represented by SYNOP and HDOBS data, and corresponding HRES forecasts for forecast day 3 from the then operational model cycle (41r1) and the then pre-operational model cycle (41r2). The new model version gives a spatial distribution similar to the operational one but with larger accumulations. Although this is a large-scale event, high-density observations are important in the evaluation of forecast performance. For example, the increased precipitation in the south-western area of Switzerland in the new cycle is better supported by HDOBS than by SYNOP alone. Conversely, the HDOBS show that the underestimation of precipitation in the north-east for both cycles is more substantial than it would appear based on SYNOP only.
Evaluation of new model cycles
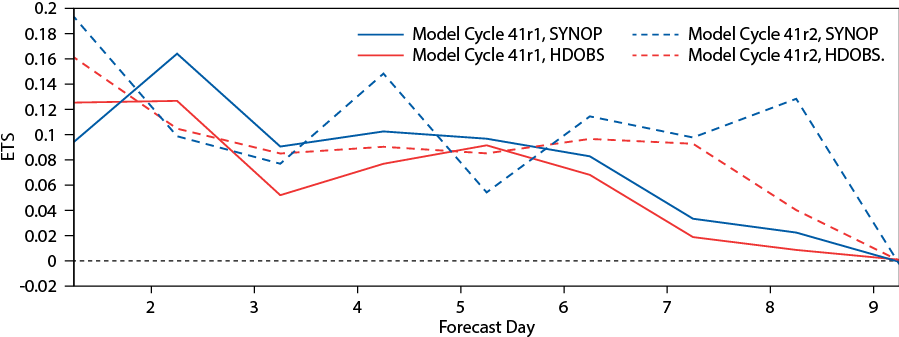
Apart from case studies, high-density observations also enhance the statistical evaluation which is required before a new model cycle can be put into operation. For heavy precipitation the limited time period over which the testing and comparisons extend (in the order of half a year) can make the identification of differences difficult. Higher-density observations reduce the noise in the scores and allow higher precipitation thresholds to be evaluated. Figure 7 shows a verification of the higher-resolution model cycle 41r2, implemented in March 2016, compared to the previous model cycle 41r1, for a threshold of 50 mm. The evaluation against HDOBS reduces the noise compared to SYNOP, providing a somewhat more robust indication of a positive effect of the new model cycle.
High-density observations in Australia
Up to now there has been little information about the skill of IFS precipitation forecasts in Australia. SYNOP observations available on the GTS from the region are mostly at non-standard times, and even if a shift of ±1 hour is allowed between validity time and actual observation time, there are only about 200 precipitation observations covering the whole continent. Recently, as part of ECMWF’s high-density verification efforts, a set of about 1,500 stations providing 24-hour precipitation totals in near real-time has been used in routine verification. This enhanced dataset, which has been made available by the Australian Bureau of Meteorology, makes it possible to verify the tropical and subtropical parts in the north of Australia separately from the extra-tropical southern areas.
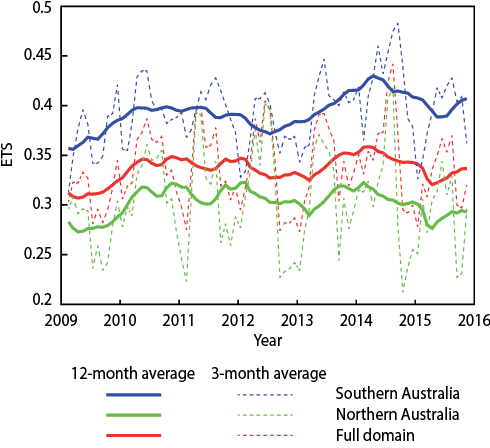
Figure 8 shows the evolution of the ETS for 24-hour precipitation at forecast day 3 for a low threshold of 1 mm, thus measuring the skill of the model in distinguishing days with precipitation from dry days. The skill averaged over the full domain has slightly increased during the period. Results for the northern and southern parts show that the increase is mainly due to improvements in extra-tropical areas. As expected, scores are higher in the non-tropical part and the difference between the two sub-areas is comparable to the amplitude of seasonal variations. These variations are stronger in the tropical than in the extra-tropical areas. Station numbers in the two sub-areas are roughly comparable although the tropical part represents a larger area. This is taken into account by the density weighting which is used, and the full domain results are accordingly closer to those for the tropical area. Results for other forecast ranges and precipitation thresholds indicate overall improvements similar to those shown in Figure 8.
Summary and outlook
The collection of high-density observations from Member and Co-operating States progressed considerably in 2015 so that the dataset can now be used routinely in model evaluation. Further increases in data coverage in Europe are expected as additional countries join the initiative. In addition, ECMWF receives surface station data for Europe as part of its EFAS activities. Tests are being carried out to see how best to merge the SYNOP, HDOBS, and EFAS datasets for use in verification. Also, the use in verification of radar-based gridded precipitation datasets, such as ODYSSEY for Europe (Lopez, 2014a), NEXRAD for the United States (Lopez, 2014b), or the MERGE satellite/rain gauge combined dataset provided by the Center for Weather Forecasting and Climate Research (CPTEC, Brazil) for South America, is being investigated. Once the period covered by a dataset has reached a few years, it can be used to improve the longer-term monitoring of forecast skill.
The upscaling of precipitation observations greatly benefits from higher-density observations. This has become especially important as ECMWF explores the scale-dependence of forecast skill at different time ranges for both upper-air and surface parameters (Buizza et al., 2015). In addition to gridded data based on rain gauge observations, verification against radar-based datasets is being tested for possible inclusion in routine evaluation of precipitation forecast skill (Rodwell et al., 2015). Further work with high-density observations will also include evaluation of extreme wind events in areas where 10-metre wind speed HDOBS are provided. We would like to take this opportunity to thank ECMWF’s Member and Co-operating States for contributing to the HDOBS effort, as well as the European Climate Assessment & Dataset (ECA&D) project for collaboration on the data transfer. Member and Co-operating States which are not yet contributing and would like to do so should contact Thomas Haiden (thomas.haiden@ecmwf.int).
FURTHER READING
Buizza, R., M. Leutbecher & A. Thorpe, 2015: Living with the butterfly effect: a seamless view of predictability. ECMWF Newsletter No. 145, 18–23.
Csima, G. & A. Ghelli, 2008: On the use of the intensity-scale verification technique to assess operational precipitation forecasts. Meteor. Appl., 15, 145–154.
Forbes, R., T. Haiden & L. Magnusson, 2015: Improvements in IFS forecasts of heavy precipitation. ECMWF Newsletter No. 144, 21–26.
Göber, M., E. Zsoter & D. S. Richardson, 2008: Could a perfect model ever satisfy a naive forecaster? On grid box mean versus point verification. Meteorol. Appl. 15, 359–365.
Lopez, P., 2014a: Comparison of ODYSSEY precipitation composites to SYNOP rain gauges and ECMWF model. ECMWF Technical Memorandum No. 717.
Lopez, P., 2014b: Comparison of NCEP Stage IV precipitation composites with ECMWF model. ECMWF Technical Memorandum No. 728.
Rodwell, M. J., L. Ferranti, T. Haiden, L. Magnusson, J. Bidlot, N. Bormann, M. Dahoui, G. De Chiara, S. Duffy, R. Forbes, E. Hólm, B. Ingleby, M. Janousek, S.T.K. Lang, K. Mogensen, F. Prates, F. Rabier, D.S. Richardson, I. Tsonevsky, F. Vitart & M. Yamaguchi, 2015: New developments in the diagnosis and verification of high-impact weather forecasts. ECMWF Technical Memorandum No. 759.

