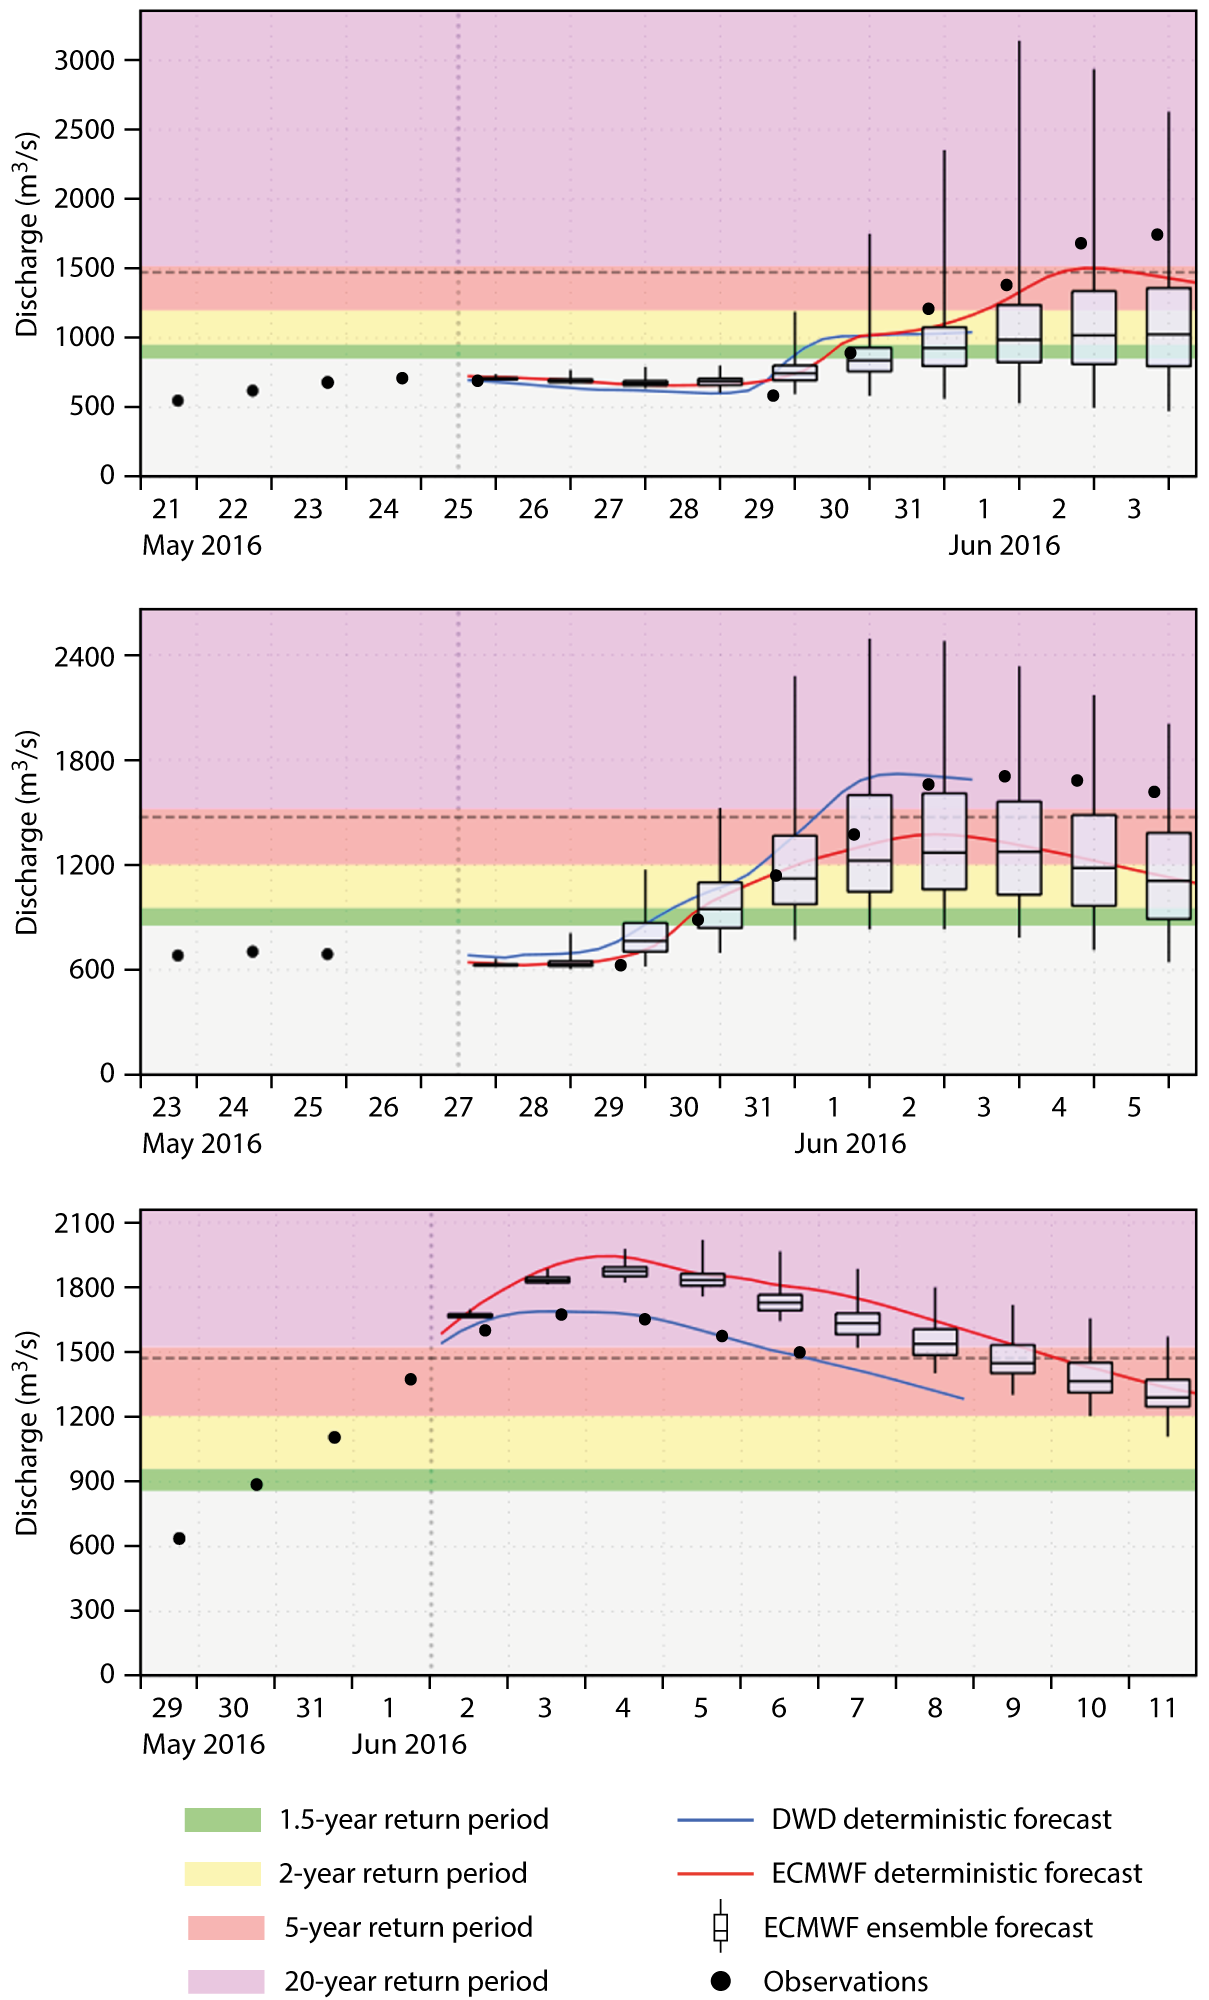
At the end of May 2016, large parts of Europe were affected by severe convective precipitation. Flash floods in several places in southern Germany led to fatalities. Further to the west, the River Seine burst its banks. The peak flow in Paris, which was reached in the early hours of 4 June, was the highest since 1982.
ECMWF’s forecast index for extreme weather showed the risk of extreme precipitation in the affected regions several days in advance. The Centre’s precipitation and temperature forecasts feed into flood forecasts issued by the EU’s Copernicus Emergency Management Service (EMS). These indicated the possibility of an event with a 20-year return period in Paris as early as 25 May.
Record precipitation
According to the French national meteorological service, Météo-France, May 2016 was the wettest since 1960 in the Île-de-France region. At the Paris-Montsouris weather station, the monthly total reached 179 mm, about three times as much as the climatological average, beating the previous record of 133 mm reached in May 1992. In the catchment area for the Seine, the soil was wet even before the most intense rainfall, which occurred around 30 May. As part of the ongoing project to collect high-density observations from national networks for verification purposes, ECMWF receives precipitation data from about 1,100 weather stations in France, a much higher number than the 190 SYNOP stations from which data is received through the Global Telecommunication System. These data enable ECMWF to better understand the spatial structure of precipitation events such as this. For 30 May 06 UTC to 31 May 06 UTC, almost all stations in northern-central France reported more than 20 mm accumulated precipitation, with a number of stations reaching 40 mm and a few more than 60 mm, which is equivalent to about a month's worth of rain. The precipitation was caused by an upper-level cut-off low that had a destabilising effect on the atmosphere and brought warm air northwards on its eastern side.
Extreme Forecast Index
ECMWF produces the Extreme Forecast Index (EFI) and the Shift of Tails (SOT) to help identify areas at risk of extreme weather. Both products compare the probability distribution function (PDF) derived from the ensemble forecast with the climatological PDF derived from a reforecast dataset. While the EFI measures the integrated shift of the PDF in the forecast, the SOT focuses on the extreme tail of the distribution. The forecast from 25 May 12 UTC indicated an increased risk of extreme precipitation for the 3-day period 29–31 May. High SOT values indicate that a few ensemble members predict extreme precipitation. The early detection of the risk of extreme precipitation was due to the large-scale forcing. Although the forecasting system is not able to correctly predict individual convective cells, the increased probability of such cells
is predictable.
Flood forecasts

The European Flood Awareness System (EFAS) uses precipitation and temperature forecasts from ECMWF, the German national meteorological service (DWD) and the COSMO consortium (COSMO Limited-Area Ensemble Prediction System forecasts) as forcings for its flood forecasts (https://www.efas.eu/user-information.html). EFAS produces medium-range probabilistic flood forecasts across Europe as part of the Copernicus Emergency Management Service – Early Warning Systems. In the figures presented here, the ECMWF ensemble forecast and high-resolution (deterministic) forecast are presented together with the DWD’s deterministic forecast. COSMO-LEPS short-range forecasts were similar to ECMWF’s predictions in this case.
The EFAS forecast system indicated the possibility of river discharge levels with a return period of more than 20 years as early as 25 May. By 26 May, a flood notification for a 1-in-20 year event was issued by EFAS for the Loing River (a tributary of the Seine). On 28 May, the warning was extended to the Seine in Paris.
As the event drew nearer, the magnitude of the predicted river discharge fluctuated between
30 May and 31 May depending on the expected rainfall for the event, but the timing was very stable, with the peak flow centred on Friday 3 June. Overall, the DWD deterministic forecast showed a more stable performance. Forecasts closer to the peak flow, for example from 2 June, showed a much smaller spread in the ensemble forecasts. This was mainly due to the fact that the major precipitation event occurred on 30 May, and the hydrological model propagated the flood wave down the Seine. The 2 June ensemble forecast generally slightly overpredicted discharge levels for the following few days. This was true for all ensemble members, indicating that the forecasts were not diverse enough to capture the observed intensity of the event. Although the ensemble spread cannot be assessed on the basis of a single case, we expect the ensemble to be over-confident as the EFAS system does not yet represent initial and model uncertainties in the hydrological model.

