
Worsening air pollution has significant implications for human health, ecosystems and the built environment. (Photo: © yocamon/iStock/Thinkstock)
Managed by ECMWF on behalf of the EU, the Copernicus Atmosphere Monitoring Service (CAMS) provides policy makers, businesses, scientists and the general public with reliable information about the composition of our atmosphere and how it is changing.
Increasing greenhouse gases, worsening air pollution and the depletion of the ozone layer have significant implications for human health, ecosystems and the built environment and are just some of the areas that CAMS is helping to address. The broad range of products in the CAMS catalogue includes solar radiation, particulates that affect air quality, pollen, and greenhouse gases. The service aims to enhance informed decision-making in key sectors such as health, energy and urban planning.
The CAMS global forecast service, which uses ECMWF’s highly skilful Integrated Forecasting System (IFS) to combine Earth observation data with the previous-day forecast to produce new analyses and forecasts, was recently upgraded to make use of ECMWF’s latest IFS forecasting model and improve the skill of key products.
CAMS was established under the wider European Union Copernicus Programme which aims to utilise the wealth of Earth observation data from satellite and ground-based systems for the benefit of all European citizens. While ECMWF is responsible for the overall management and coordination of CAMS, the service as a whole consists of over 50 service providers from 20 different European countries. As well as CAMS, ECMWF also operates the Copernicus Climate Change Service (C3S). Data from all Copernicus services are open access and free to all.
Some examples of CAMS products and their applications
Air quality and composition
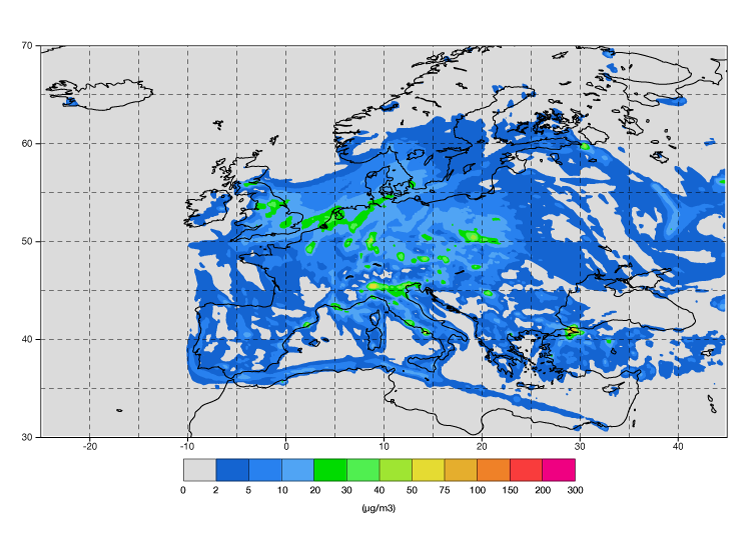
Each day CAMS produces real-time analyses and forecasts of atmospheric composition for the globe as well as a more detailed regional view of European air quality. The regional European products provide forecasts out to 4 days, covering 10 chemical pollutants and pollen at a spatial resolution of 10 km using an ensemble of seven air quality models. Such information can be used, for example, to help predict air quality conditions in European cities. Importantly, CAMS can provide air quality boundary conditions for national level pollution forecasting systems.

The figure shows the CAMS European air quality ensemble forecast of nitrogen dioxide at the surface for 17 October 2017 00UTC, based on 16 October 00UTC.
Reanalysis air quality products for the globe and for Europe are also produced with a frozen model/data assimilation system and this provides consistent air quality information looking back in time. This information can help to support policy applications in particular, for example, monitoring how air quality has changed over time and assessing how new regulations have affected air quality.
Climate change
The global climate is changing as a result of human induced emissions of greenhouse gases – carbon dioxide in particular. To understand climate change and to support worldwide policy to tackle the problem, it is vital to have information on greenhouse gases and aerosols, how they are changing and how this is affecting climate.
To support such questions, CAMS is providing estimates of the global scale fluxes of carbon dioxide and other greenhouse gases contributing to documenting the activity of the carbon cycle in the Earth system. In addition, the global reanalysis of atmospheric composition is used to provide estimates of the impact of aerosols, greenhouse gases and ozone on the Earth radiation budget, the so-called climate forcing, and how it has changed over time.
The ozone layer
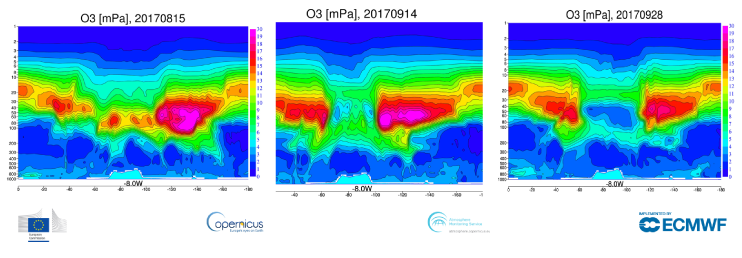
CAMS also monitors the ozone layer and has been able to chart the changes in the ozone hole over recent decades. Monitoring the ozone layer is important in order to assess its expected recovery as levels of ozone-damaging chlorofluorocarbons (CFCs) and halons, formerly found in aerosol spray cans and refrigerants, gradually decline in the atmosphere.
CAMS produces high-quality ozone forecasts and analyses which can be used, for example, to feed into public warning systems of potentially harmful levels of ultraviolet radiation as ozone levels fall. The CAMS analyses and forecasts are a recurring feature of the Antarctic Ozone Bulletins of the World Meteorological Organization (WMO).
CAMS is also improving the modelling of stratospheric chemistry by considering not just ozone, but also many other chemical species (including ozone-depleting substances) to better understand the ozone-hole healing process.
The Antarctic ozone hole forms during the coldest winter months (July, August), with a recovery of ozone levels during other seasons. The figure below shows the development of the Antarctic ozone hole during 2017. September 2017 saw an unusually small ozone hole, thought to be due to stratospheric temperatures being less cold than normal.

The figure shows the development of the ozone hole over Antarctica from August to September 2017.
CAMS recent upgrade
In September 2017, the CAMS global forecast system underwent a major upgrade in order to use the latest version of the ECMWF Integrated Forecasting System.
With this upgrade, aerosols and chemical species will now be chemically interacting with each other in the forecast model for the first time. This is making the representation of atmospheric composition processes much more realistic, and it will allow improved accuracy of the CAMS global forecasts.
The upgrade also means that more aerosol data from satellites are now incorporated into the analyses, which is helping to improve the initial state from which forecasts are subsequently run.
Finally, the accuracy of the UV forecasts has been improved, which corrects the overly high values that were seen over (sub-)tropical areas with the previous operational version.
