
El Niño conditions in the central Pacific have now reached their peak, setting new records for sea-surface temperature in the central and western equatorial Pacific.
The current El Niño event is expected to decline fairly rapidly in the coming months.
However, anomalies will still be large while this process takes place.
An El Niño event is a prolonged period of abnormally high sea-surface temperatures (SSTs) in the tropical Pacific Ocean.
New records
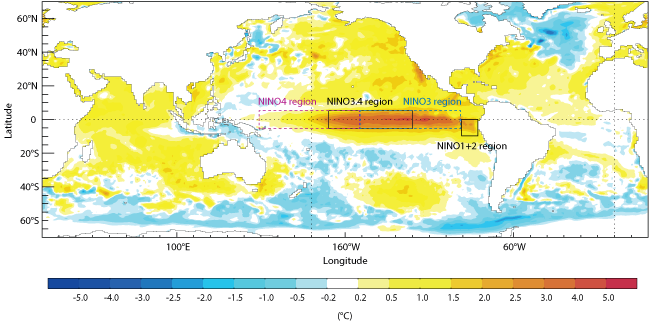
SSTs in the NINO3.4 region in October were already very close to record-high values. During November they increased further as a delayed response to a westerly wind burst in October.
The resulting peak in SSTs has broken monthly mean records in the NINO3.4 region:
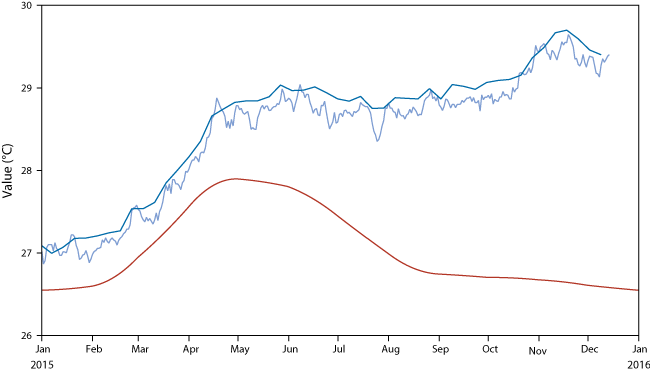
- the highest ever recorded absolute SST value (29.6 °C, breaking the record of 29.4 °C set in January 1983, and the November record of 29.3 °C set in 1997)
- and the highest ever anomaly (3.0 °C, compared to 2.8 °C in January 1983)
The monthly mean December SST is also likely to be a record high, ahead of both 1982 and 1997.

Average sea-surface temperature anomalies in November 2015. The chart shows sea-surface temperature anomalies compared to the 1981–2009 average.
Records have also been broken in the western-central Pacific: the monthly mean NINO4 SST exceeded 30 °C for the first time, reaching 30.3 °C and beating the previous record of 29.9 °C set in June this year.
In terms of anomalies, the record prior to 2015 in the NINO4 area was 1.3 °C, set in 2009. The modest size of this previous record underlines how stable ocean temperatures are in this part of the Pacific. The NINO4 anomaly this November was 1.7 °C, a significant increase on the previous record.
SST analyses become less precise going back in time, but the size of the anomalies in NINO4 and NINO3.4 means we are fairly confident that these are record values for the whole of the observational period back to 1860.

Average and observed sea-surface temperatures in NINO3.4. The chart shows the average evolution of sea-surface temperatures in the NINO3.4 region based on the years 1981 to 2010 (red line) and the observed evolution since January 2015 according to two different analyses (dark and light blue lines). The difference between the red and blue lines is the sea-surface temperature anomaly.
In the eastern Pacific, the El Niño event is very strong but not record-breaking. The anomaly in the NINO1+2 region was 2.1°C in November, down from a peak value of about 2.9 °C in July. This is the third-strongest El Niño event in this region in the satellite-era record but still a long way behind 1982 and 1997, both of which had anomalies exceeding 4 °C.
The NINO3 anomaly for November was 2.9 °C, which is the second-highest November value on record behind 1997. In 1982/83, the NINO3 anomaly peaked at 3.3 °C in January 1983, whereas it is likely that the 2015 anomaly has already peaked. The 1997 peak anomaly was 3.6 °C.
Latest forecasts
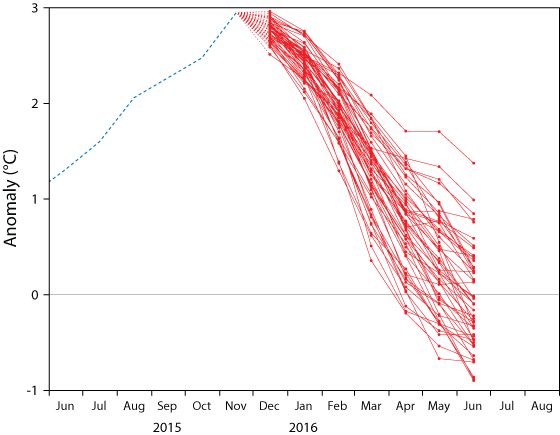
The latest forecasts suggest that SST anomalies in the central Pacific have now reached their peak and will start to decline. Although there is some uncertainty related to the winds, the forecasts do suggest that the amplitude of El Niño is likely to decline fairly rapidly in the early part of 2016, with NINO3.4 cooling to 1 °C by April.

ECMWF plume of NINO3.4 sea-surface temperature anomalies. The chart shows the predicted sea-surface temperature anomalies over the NINO3.4 region produced on 1 December from the ECMWF model. Ensemble forecasts account for the uncertainties inherent in the prediction of weather and ocean parameters by producing a set of possible outcomes.
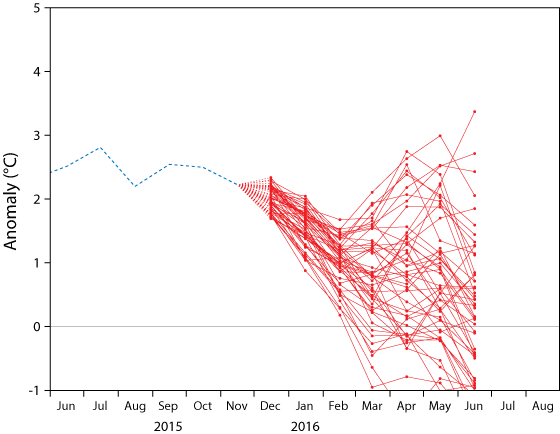
Forecasts for NINO1+2 suggest that, although anomalies will continue to decline until February, after that there is considerable uncertainty.

ECMWF plume of NINO1+2 sea-surface temperature anomalies. The chart shows the predicted sea-surface temperature anomalies over the NINO1+2 region produced on 1 December from the ECMWF model.
Multi-model boost
ECMWF not only runs its own seasonal forecasting system, it also leads the EUROSIP multi-model seasonal forecasting project, where data from several major forecasting centres (ECMWF, the UK Met Office, Météo-France and the US National Centers for Environmental Prediction) are combined to make the EUROSIP multi-model products.
Earlier this month, a provisional agreement for the Japanese Meteorological Agency (JMA) to join EUROSIP was reached.
The Japanese models and initialization are fully independent of those used in Europe, which increases the value of the forecasts as inputs to the EUROSIP multi-model seasonal forecast capability.
There will now follow a six-month period of ingesting the Japanese data and preparing updated EUROSIP products, with the aim of being ready to issue the enhanced multi-model forecasts as soon as possible after the agreement with JMA is authorized at the June 2016 meeting of the ECMWF Council.
