
Global-average air temperature has been exceptionally high over the past ten months.
This can be attributed to both natural climatic variability and an underlying trend of global warming.
Factors include a strong El Niño, generally warm sea-surface temperatures and below-average sea-ice cover in the Arctic.
An El Niño event is a prolonged period of abnormally high sea-surface temperatures (SSTs) in the tropical Pacific Ocean.
Generally warm conditions have persisted in Europe since 2014.
Record temperatures
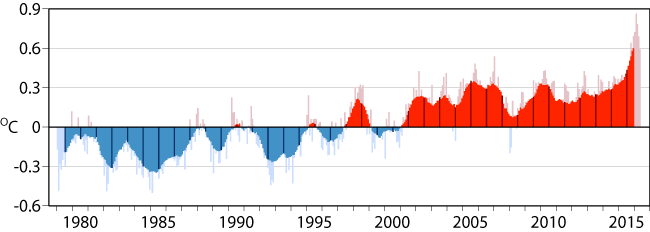
The latest monthly temperature summary prepared by the Copernicus Climate Change Service, based on ECMWF’s ERA-Interim reanalysis of observations made since 1979, shows that May 2016 was more than 0.2°C warmer globally than the previous warmest May, which occurred in 2010. May 2016 was 0.6°C warmer than the average May from 1981 to 2010.
According to ERA-Interim data, every month since August 2015 has been warmer than its counterpart in earlier years. February 2016 was the most extreme month in the recent spell, with a temperature close to 0.9°C above the 1981-2010 average.
February 2016 was also extreme in being more than 0.5°C warmer than expected from the underlying level of global warming, as represented by fitting a linear trend to global-mean temperatures since 1979.
The 12-month average value from June 2015 to May 2016 is 0.60°C, significantly higher than the record annual value of 0.44°C reached in 2015.

Global-mean surface air temperature anomalies relative to 1981-2010, from January 1979 to May 2016. Twelve-month running average values shown in deeper shades of red and blue are superimposed on the monthly values visible in pale red and blue. Dark bars denote the annual averages for the years from 1979 to 2015.
Placing these numbers in the context of the Paris Agreement to limit the increase in global temperature above pre-industrial levels, reached by nations late in 2015, is not straightforward.
This is because of uncertainty over the amount temperatures rose from the end of the pre-industrial period to the recent decades when the atmosphere was much more completely observed than before. Evidence points to a rise of around 0.7°C to reach the 1981-2010 average, with a margin of error of 0.1°C or more.
Early in 2016, however briefly, global temperature may thus have first reached or breached a level 1.5°C above the average global temperature early in the Industrial Revolution.
The 1.0°C level was likely briefly touched in 1998, and reached more frequently from 2002 onwards. Like 2016, 1998 was a year that started as unusually warm El Niño SSTs in the tropical eastern Pacific were beginning to decline.
Contributing factors
When seeking to interpret variations in the global temperature record such as the latest one, it is a challenge to disentangle the interacting contributions from the climate system’s intrinsic variability and from the variability and change forced by anthropogenic and natural external factors.
The extremity of air temperatures in 2015/16 cannot be ascribed only to the latest El Niño, which was not as strong as that in 1997/98. SSTs were generally lower in 2015/16 than in 1997/98 over the tropical eastern Pacific Ocean, but mostly higher elsewhere.
In addition, the Arctic winter of 1997/98 was colder than the average for 1981-2010. This was associated with above-average sea-ice cover over the Barents and Kara Seas, from Svalbard to east of the Novaya Zemlya archipelago in northern Russia. In contrast, 2015/16 was characterised by below-average sea-ice cover and above-average temperatures over this region.
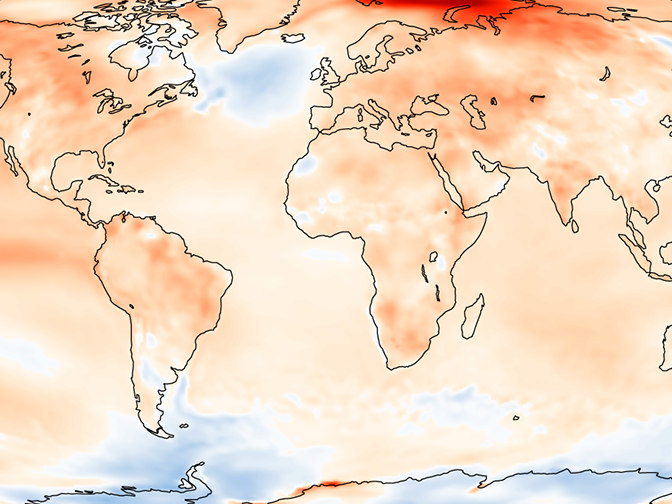
The map of mean temperature for the 12-month period from June 2015 to May 2016 shows both the warm El Niño conditions over the tropical eastern Pacific and the above-average Arctic temperatures. It also shows that temperatures were above average almost everywhere over land, with Antarctica the main exception. Temperatures over the oceans were predominantly above average.

Surface air temperature differences from 1981-2010 values. The left-hand panel shows the 12-month average from June 2015 to May 2016, and the right-hand panel the average for May 2016.
The map for May 2016 shows below-average temperatures in a narrow band along the equator over the eastern Pacific Ocean, indicating that a transition from El Niño to La Niña conditions has recently occurred. Relatively warm conditions persist in the Arctic.
Temperature deviations from long-term averages over land can vary markedly from region to region and month to month. May 2016 is no exception in showing both relatively cool and relatively warm regions, although the latter predominate.
The large temperature anomalies shown offshore of Antarctica are likely due to anomalies in sea-ice cover located where near-surface winds had unusually strong northerly or southerly components.
Conditions in Europe
European average temperatures are generally marked by substantial month-to-month variability.
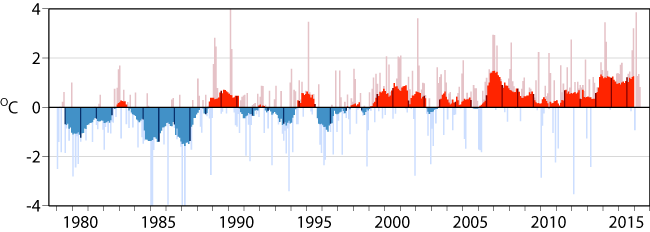
Well-above normal temperatures in December 2015 were followed by temperatures in January 2016 that were predominantly below normal. Temperatures switched back to well-above normal in February. The values from March to May 2016 are above average but not exceptional.
Twelve-month averages for Europe have been at a persistently high level for more than two years, though lower than averages from around the middle of 2006 to the middle of 2007.

European-mean surface air temperature anomalies relative to 1981-2010, from January 1979 to May 2016. Twelve-month running average values shown in deeper shades of red and blue are superimposed on the monthly values shown in pale red and blue. Dark bars denote the annual averages for the years from 1979 to 2015. Averages are taken over land areas between 20°W and 40°E, and 35°N and 80°N.
About the data
All datasets are subject to some uncertainties, and ERA-Interim is no exception. The values presented here have been processed in the same way as those presented in the Copernicus Climate Change Service’s monthly summaries, which provide further details and a video showing the global evolution of temperature since 1979.
A new ERA Report compares values from ERA-Interim with those from other reanalyses and from datasets based on monthly climatological data.
