
One of the strongest El Niño events on record peaked in November 2015. How predictable was it? And is it the most extreme ever?
An El Niño event is a prolonged period of abnormally high sea-surface temperatures (SSTs) in the tropical Pacific Ocean.
It goes hand in hand with changes in large-scale atmospheric conditions and can have strong repercussions on global weather patterns. El Niño can also significantly affect the global average temperature and hence influence the global warming signal.
How early was the current event predicted?
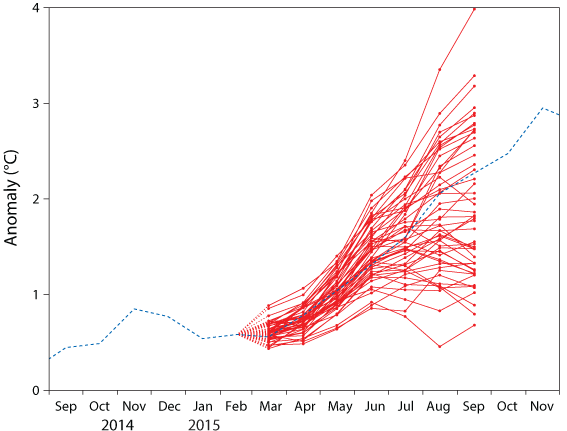
Weak El Niño conditions had been observed since October 2014. By March 2015, forecasts suggested that SST anomalies in the NINO3.4 region in the central Pacific would rise further, from about 0.5°C to more than 1°C by August, with the possibility of substantially stronger warming.
However, uncertainty in the forecasts prompted the World Meteorological Organization (WMO) to be cautious. “While current forecasts imply that a careful watch must be kept on the tropical Pacific Ocean temperatures, it is too early to assess the strength of any potential event,” a WMO update said at the time.
By August, observed anomalies in the NINO3.4 region had risen to about 2°C, and forecasts suggested that there would be a very strong and potentially record-breaking event by the end of the year.
What were the predictions based on?
All forecasts start with an estimate of the current state of the atmosphere and the oceans, based on observations and previous forecasts. The laws of physics then make it possible to predict how that state is likely to evolve.

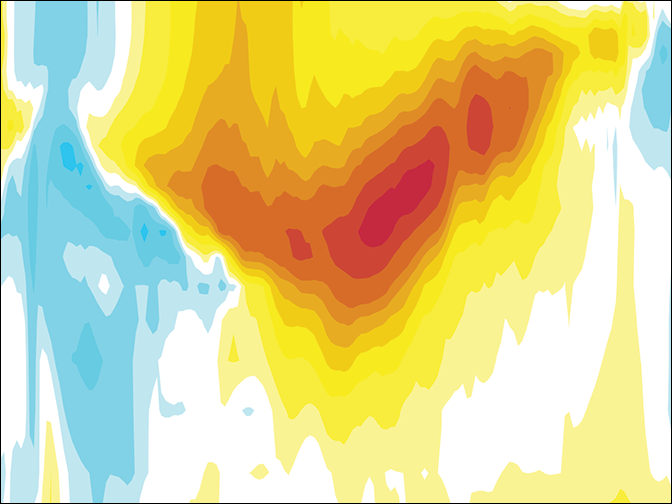
As early as March 2015, large ocean temperature anomalies in the central Pacific Ocean were detected at depths between about 50 and 200 metres. The chart shows mean potential temperature anomalies in March 2015 in equatorial section, compared to the 1981–2009 average. A large range of ocean reanalysis charts are available on ECMWF's website.
In the case of El Niño, SST anomalies in the equatorial Pacific are closely related to the strength and direction of the wind.
The usual easterly winds in the region push warm surface water away from the equator via a process called Ekman transport: due to the rotation of the Earth, the easterly winds push the water to the north in the northern hemisphere, and to the south in the southern hemisphere, resulting in upwelling of cold water at the equator from below the surface.
The winds also lead to a piling up of warm surface water in the western Pacific, and they result in a characteristic shape of the thermocline (the boundary between warm surface and cold sub-surface water), with cold water just below the surface in the eastern Pacific.
When the easterly winds weaken or even turn into westerlies, several processes act to produce warm SST anomalies in the central and eastern Pacific:
- the thermocline is pushed down, so that sub-surface water is warmer, as shown in the chart above
- the amount of upwelling is reduced
- surface currents change, such that warm surface water flows from west to east instead of cold water from east to west.
The combination of these processes, and how they vary over time, gives rise to the varied ways in which El Niño events can develop.
How good were the forecasts?
Our model simulations and our knowledge of the current state of the atmosphere and oceans are never perfect. That is why all atmospheric and ocean predictions come with a degree of uncertainty. This uncertainty can be captured by producing a set of predictions, each based on slightly different initial conditions and model simulations.
If all predictions in such ‘ensemble forecasts’ are very similar, the degree of confidence we can have in the forecast is high. If their spread is great, on the other hand, the confidence is lower.


ECMWF ensemble forecasts of monthly mean NINO3.4 SST anomalies issued on 1 March (top) and 1 August (bottom). The dotted line shows the observed evolution of SST anomalies. A range of past and current El Niño forecast plumes are available on ECMWF's website.
ECMWF’s ensemble forecast for SST anomalies in the NINO3.4 region issued on 1 March 2015 predicted the observed outcome well although there was growing uncertainty at longer lead times.
The 1 August forecast captured the structure of the evolution of SST anomalies fairly well, but many ensemble members predicted higher peak anomalies than the value that was eventually observed.
As discussed when the forecast was issued, the highest model forecast values were considered unrealistic due to known non-linearities in the model behaviour during extreme events.
Is this the strongest El Niño ever?
The two strongest El Niños of the 20th century were those of 1982/83 and 1997/98, each of which was considered at the time as a ‘once-in-a-century’ event.
The El Niño of 2015/16 is in the same class as those of 1982/83 and 1997/98, and it set new records in the NINO4 and NINO3.4 regions in the western and central Pacific.

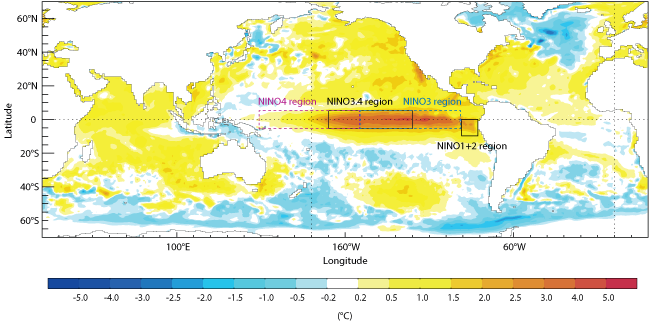
Average sea-surface temperature anomalies in November 2015, when the El Niño event peaked in the NINO3.4 region. The chart shows SST anomalies compared to the 1981–2009 average.
At its peak in November 2015, the NINO3.4 SST anomaly reached 3.0°C, breaking the previous record of 2.8°C set in January 1983.
In the NINO4 region, large positive anomalies are hard to achieve because average conditions are already warm. In 2015, the anomaly reached 1.7°C, a substantial increase of 0.4°C on the previous record, set in 2009.
SST analyses become less precise going back in time, but the size of the anomalies in NINO4 and NINO3.4 means we are fairly confident that these are record values for the whole of the observational period back to 1860.
In the NINO3 and NINO1+2 regions in the eastern Pacific, on the other hand, the current El Niño has remained below the level of the 1982/83 and 1997/98 events.
The chart below puts the current event in the context of the last 20 years. It shows the evolution of SST anomalies at the equator from January 1995 (bottom) to December 2015 (top), with conspicuous spikes in 1997/98 and at the end of 2015.
In between, the chart shows more or less regular fluctuations between warm El Niño conditions and colder episodes in the central and eastern Pacific, dubbed La Niña.

Observed sea-surface temperature anomalies at the equator up to December 2015, compared to the 1981–2009 average.
