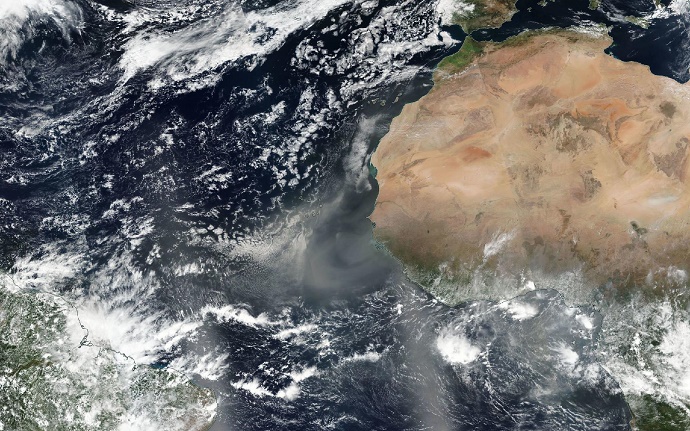

This visible light satellite image shows large plumes of dust off the west coast of Africa and over the Gulf of Guinea on 1 March 2017. (Image: NASA)
ECMWF scientists have made progress in using visible light satellite data to estimate the concentration of small particles suspended in the atmosphere (aerosols). Their work could pave the way for the fuller use of such data in numerical weather prediction.
The ground-breaking results were obtained as part of the two-year Aerosol Radiance Assimilation Study (ARAS) project, which ended in April 2020. Five scientists, including four from ECMWF, participated in this ESA-funded project.
What ARAS achieved
Satellite observations in the infrared and microwave parts of the spectrum have long been assimilated into forecasting systems to help estimate the best possible initial conditions for global weather predictions.
Assimilating radiances in the visible part of the spectrum, on the other hand, continues to pose many challenges.
The reason lies in the complex interactions of cloud and aerosol particles with radiation at those wavelengths and in the complex characteristics of the surface as a reflector of visible light.
These complications make it difficult to develop an ‘observation operator’, which converts model values into satellite observation equivalents.
One of the key achievements of ARAS is to have developed an observation operator for aerosol reflectances in the visible part of the spectrum.
This enabled the first-ever experimental assimilation of reflectances into the 4D-Var assimilation system of ECMWF’s Integrated Forecasting System (IFS) to help estimate aerosol concentrations.
“The assimilation experiments were very successful,” says ECMWF scientist Samuel Quesada-Ruiz. “Performance is remarkable considering that this is a new development rolled out over the course of just two years.”
Impact of assimilation
A dust event coming from the Sahara Desert on 1 March 2017 illustrates what difference the assimilation of visible radiances can make.
The figure below shows total aerosol optical depth (AOD) at 550 nm in the IFS analysis without any assimilated aerosol data (left) and with the assimilation of visible reflectances (middle). It also shows satellite‐derived AODs at the same wavelength (right).
In this event, observations show that there were two plumes. They can be seen in the satellite-derived AOD plot below (right) and also in the visible light image above.
The first one, crossing the Atlantic Ocean at around 10°N, is better represented in the analysis with the assimilation of visible radiances than without. The second one, in the Gulf of Guinea, is mostly missed in the analysis without any assimilated aerosol data. The assimilation of the radiances brings clear benefits in this case.
The left-hand plot shows total aerosol optical depth (AOD) at 550 nm in ECMWF’s analysis for 12 UTC on 1 March 2017 without the assimilation of aerosol information; the middle plot shows the same with the assimilation of reflectances from the MODIS instrument at two different wavelengths (670 nm and 866 nm); and the right-hand plot shows total AOD at 550 nm from MODIS for 1 March 2017.
Assessing the results
The observations used in the ARAS project are level 2 aerosol reflectances from the MODIS instrument on board the Aqua and Terra satellites.
Experiments have been carried out to compare the impact of assimilating these observations with the impact of assimilating traditional satellite-derived AOD observations.
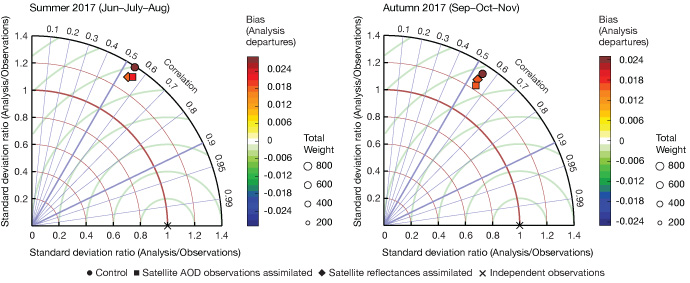
“The results show that the performance of reflectance assimilation is broadly comparable to that of satellite AOD assimilation,” says Samuel. “However, it varies depending on the metrics used and the period analysed.”

These plots show the results of assimilation experiments at a wavelength of 870 nm for summer and autumn 2017. The circles represent the analysis in the control experiment, in which no aerosol observations were assimilated; the squares represent the analysis in an experiment in which traditional satellite AOD observations were assimilated over the ocean; and the diamonds represent the analysis in an experiment in which satellite reflectances were assimilated over the ocean. The crosses on the x-axis represent independent AERONET ground-based observations. The closer the symbols are to the crosses, the better the respective analysis agrees with the AERONET observations.
Outlook
While assimilating aerosol reflectances is still experimental, the results show great potential for future operational implementation in atmospheric composition forecasts.
Such forecasts are routinely produced by the EU‐funded Copernicus Atmosphere Monitoring Service (CAMS) implemented by ECMWF.
But the scope for future applications is much wider than that.
“Many of the tools developed in ARAS for aerosol visible reflectance assimilation could be adapted to clouds,” says ECMWF scientist Angela Benedetti.
“This could open the way towards a fuller exploitation of visible radiances to improve numerical weather prediction.”
