
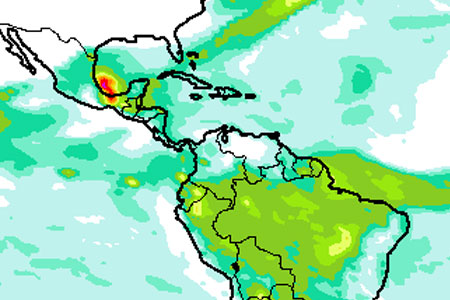
ECMWF and Ecuador’s national hydro-meteorological service, the Instituto Nacional de Meteorología e Hidrología (INAMHI), have just signed a new collaborative agreement for data exchange and verification of new post-processed rainfall products (“ecPoint-Rainfall”), with one long-term goal being flood impact mitigation.
ECMWF and INAMHI strongly supported the establishment of this collaboration because both believe that it can be mutually beneficial. Indeed, at the signing of the agreement INAMHI provided the following feedback: "It is a pleasure for INAMHI to be part of this project because innovative approaches in technological and societal fields will lead to substantive positive results in terms of reducing vulnerability to natural hazards, and, in these ways, Ecuador also expects to acquire new tools to help it to adapt to climate change”.
INAMHI will have free access to ecPoint-Rainfall products (charts and gridded data) for one year, for test and verification purposes only (commercial use is not allowed). This arrangement is made possible under a collaborative research agreement with ECMWF through special authorisation by the Director of ECMWF’s Forecast Department.
About ecPoint-Rainfall
ecPoint-Rainfall is part of an innovative statistical post-processing system that defines a probabilistic relationship between raw rainfall forecasts at grid-box scale and expected rainfall totals at point-scale within each grid-box. It uses the rainfall forecasts from ECMWF’s global ensemble (ENS) and relies on a physics-based understanding of source of errors within the model’s rainfall generation mechanisms to account for both weather-dependent sub-grid variability, and weather-dependent model biases all around the world.
So ecPoint-Rainfall delivers a new forecast product for rainfall that provides more reliable and more skilful forecasts of areas at risk of localized heavy rainfall.
The ecPoint-Rainfall project developed from ideas submitted to the Harry Otten “Prize for Innovation in Meteorology” in 2015, which reached the final of the contest. Following this, in 2016, work began to convert the idea into a real-time forecast product. Latterly the work has also been supported by the University of Reading as part of a PhD.
Why did ECMWF pursue this agreement, and how will it work?
In 2017 several countries in South America, such as Peru, Argentina, Uruguay, Brazil and Ecuador, experienced very heavy rainfall events that led to devastating floods. Peru was one of the most affected countries and it was given access to ECMWF products (ecPoint-Rainfall was one of those) to help during and after the emergency. Following this positive experience, the ecPoint-Rainfall development team decided to start similar collaborations with other countries. Ecuador was the first to sign this new agreement, and we hope it will be the first of a bigger list.
For ECMWF one of the main objectives is to promulgate ecPoint-Rainfall products to a wider community. Over time we would like to see hydro-meteorological services become familiar with the new products and use them routinely for forecasting. However, the ecPoint-Rainfall post-processing system introduces new concepts, so forecasters need to become familiar with them in order to use the products correctly.
For example, what does “point-rainfall” mean? Point-rainfall forecasts aim to provide accurate, unbiased probabilistic predictions of what would be measured at a rain gauge sited anywhere within the grid box in question (although nothing can actually be said about the location of any heavy rain within the grid box). The information that can be retrieved from these new probabilistic products is different from what forecasters are familiar with, namely standard unprocessed probabilistic output from ensembles that are applied to grid-box average rainfall totals (i.e. at the scale of the grid of the driving ensemble). Therefore, the distribution of the new products will be accompanied by appropriate training (such as webinars, skype calls or emails) to help end users understand what complementary information can be obtained from the new products, and what their limitations might be. Of course, it will be very valuable for us if INAMHI could give some feedback on the training itself and the documentation, so it can be adapted/modified to be more valuable to the end user.
This agreement will also provide ECMWF with external, independent feedback on product performance, especially during extreme rainfall and flood events. Indeed, INAMHI will carry out independent verification work and will provide a report that will contain the most significant cases in which the new products were used, as well as a critique on their performance. These case studies are considered an invaluable source of independent verification because the ECMWF development team will not be involved. It has also been agreed that ECMWF can use the case studies in scientific publications regarding ecPoint-Rainfall, offering collaborations and co-authorship with nominees from the INAMHI working group.
Finally, ECMWF would like to obtain extra meteorological and hydrological observations, which will help with internal verification and further improvement of the product, as well as the development of related flood forecasting tools. As part of the arrangement, INAMHI has agreed to provide some additional meteorological and hydrological observations.
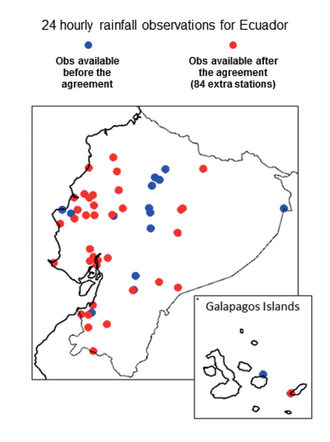
The location in Ecuador of the 24-hourly rainfall observations that were available at ECMWF before the agreement (in blue), and the additional observations (in red) that will be available after the agreement.
It is worth saying that the ecPoint-Rainfall calibration and verification processes do not need observations with a high spatial or temporal resolution. However, there are two limitations imposed by what data are currently available:
- 6 hours is currently the minimum accumulation period that we can use for point rainfall.
- Certain parts of the world have poor observational coverage, and it would be nice to include those in the calibration and verification procedures.
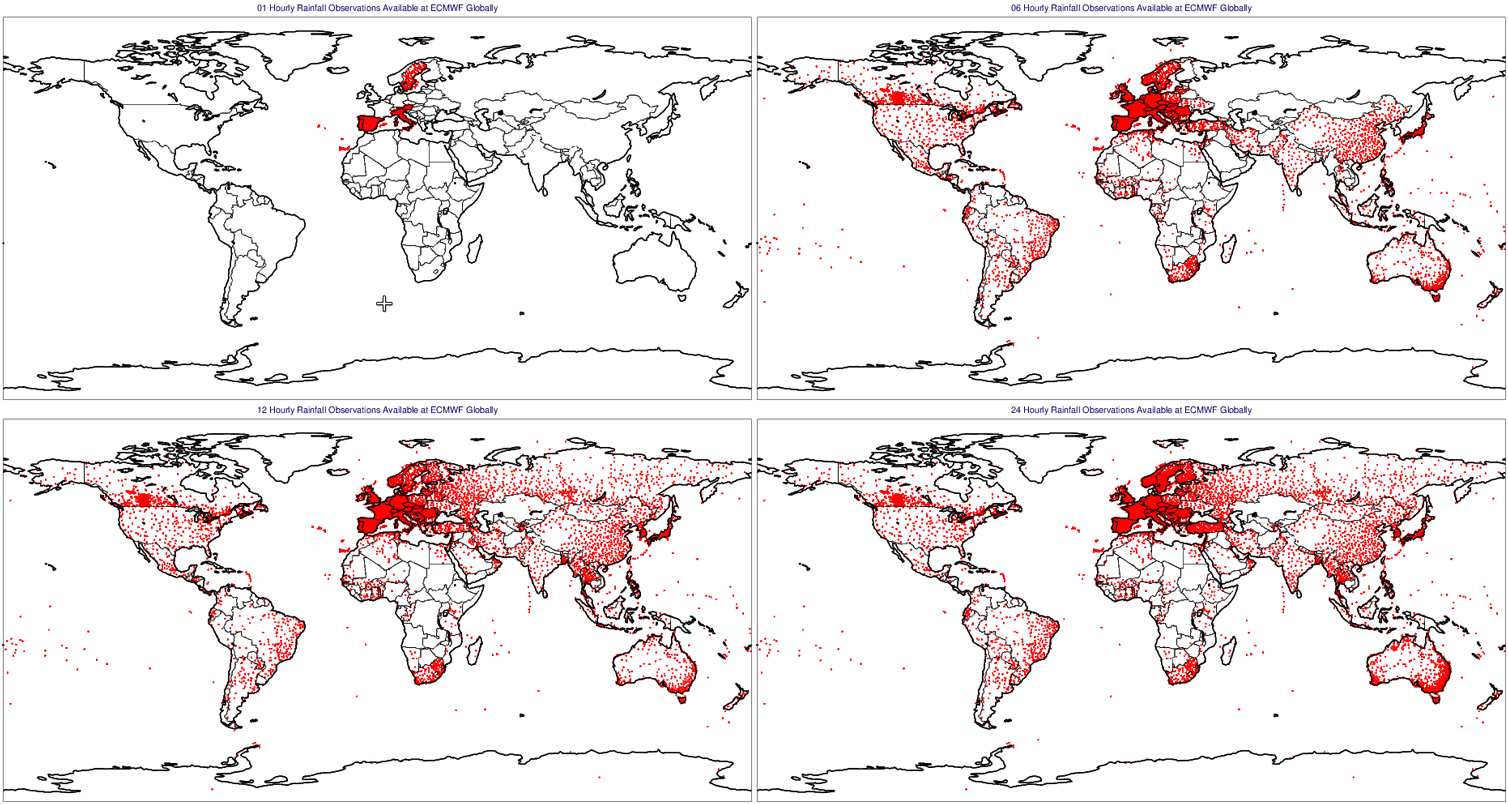
The location of all rainfall observations for 1, 6, 12, and 24-hourly accumulations on one particular day available at ECMWF. Some parts of the world have poor observational coverage.
Which products are made available through this agreement?
The main output formats that will be made available, for 12-hour periods, are:
- Map format, for any lead time up to day 10
Such plots give an immediate probabilistic picture of where heavy rainfall may occur, and can also give a much better idea than the raw model of the chances of dry weather. Analysing the differences between the raw ENS and ecPoint-Rainfall, it is possible to pinpoint immediately where the raw forecast (averages over the grid box) is not representative of point values.
Two different products can be displayed:- Point rainfall percentiles (in mm)
- Probabilities (in %) of exceeding, or not exceeding, certain rainfall thresholds at a point (within a grid box)
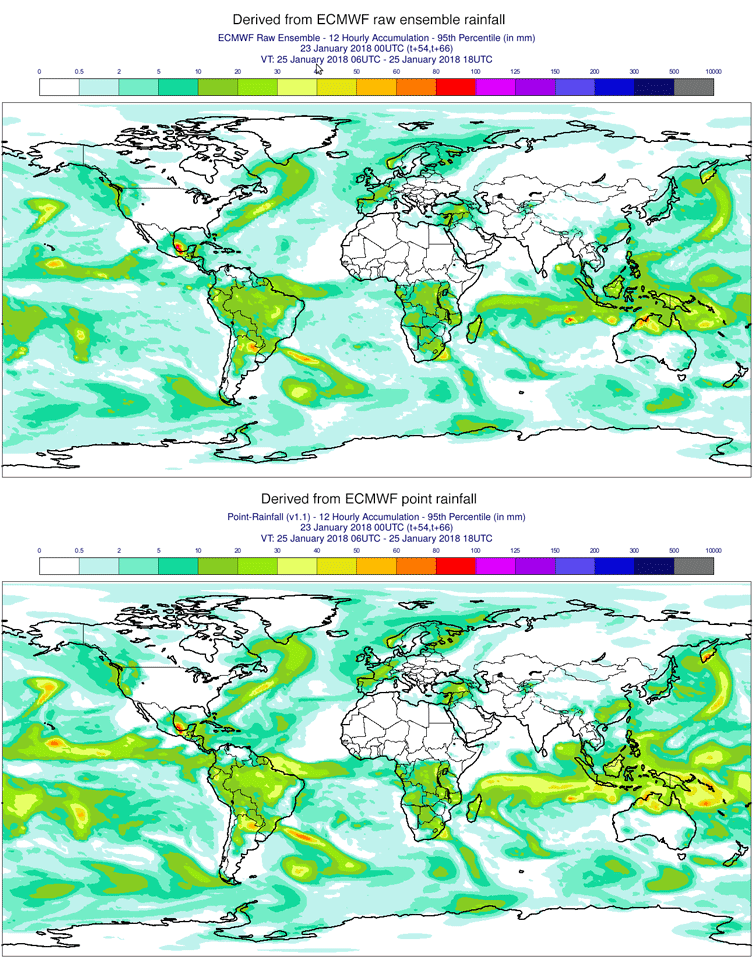
An example of rainfall percentiles derived from raw ensemble data and from ecPoint-rainfall for a day 3 forecast and rainfall accumulated over 12 hours. The values shown (in mm) have a 5% probability of being exceeded.
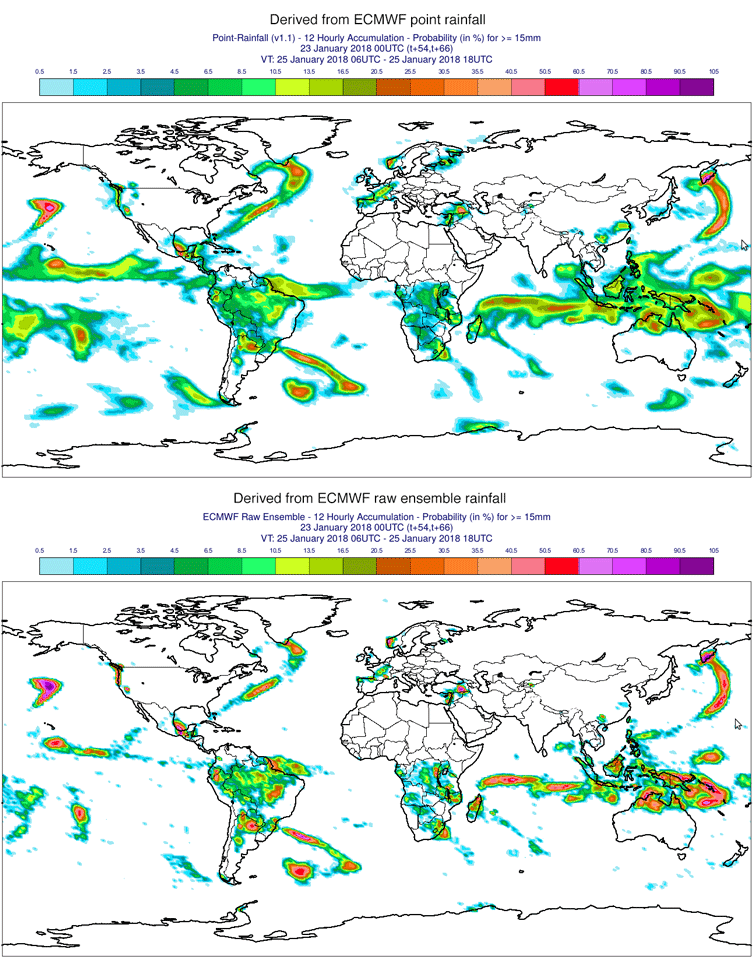
This example, for a day 3 forecast and rainfall accumulated over 12 hours, illustrates how probabilities of exceeding a given rainfall threshold (15 mm in this example) can vary between the raw ensemble data and ecPoint-Rainfall.
- Cumulative distribution functions (CDFs) of point rainfall versus raw ensemble, for any lead time and for any location
The CDFs illustrate the differences that the post-processing makes, and can fully explain how such differences arise.

CDFs of rainfall accumulated over 12 hours, for a site in central France, on forecast day 3; red is the raw ensemble, blue the post-processed point rainfall. Data in the lower right facilitates understanding of the reasons for the CDF differences.
INAMHI will have access to regional versions of these products in map format, and to selected locations for the CDFs.
Finally, since INAMHI will also have access to the gridded data, it will be possible for them to visualise it alongside other products or observations according to their needs, as shown in the example below. This type of plot should enhance their forecasts, and quantitative assessments will be facilitated.
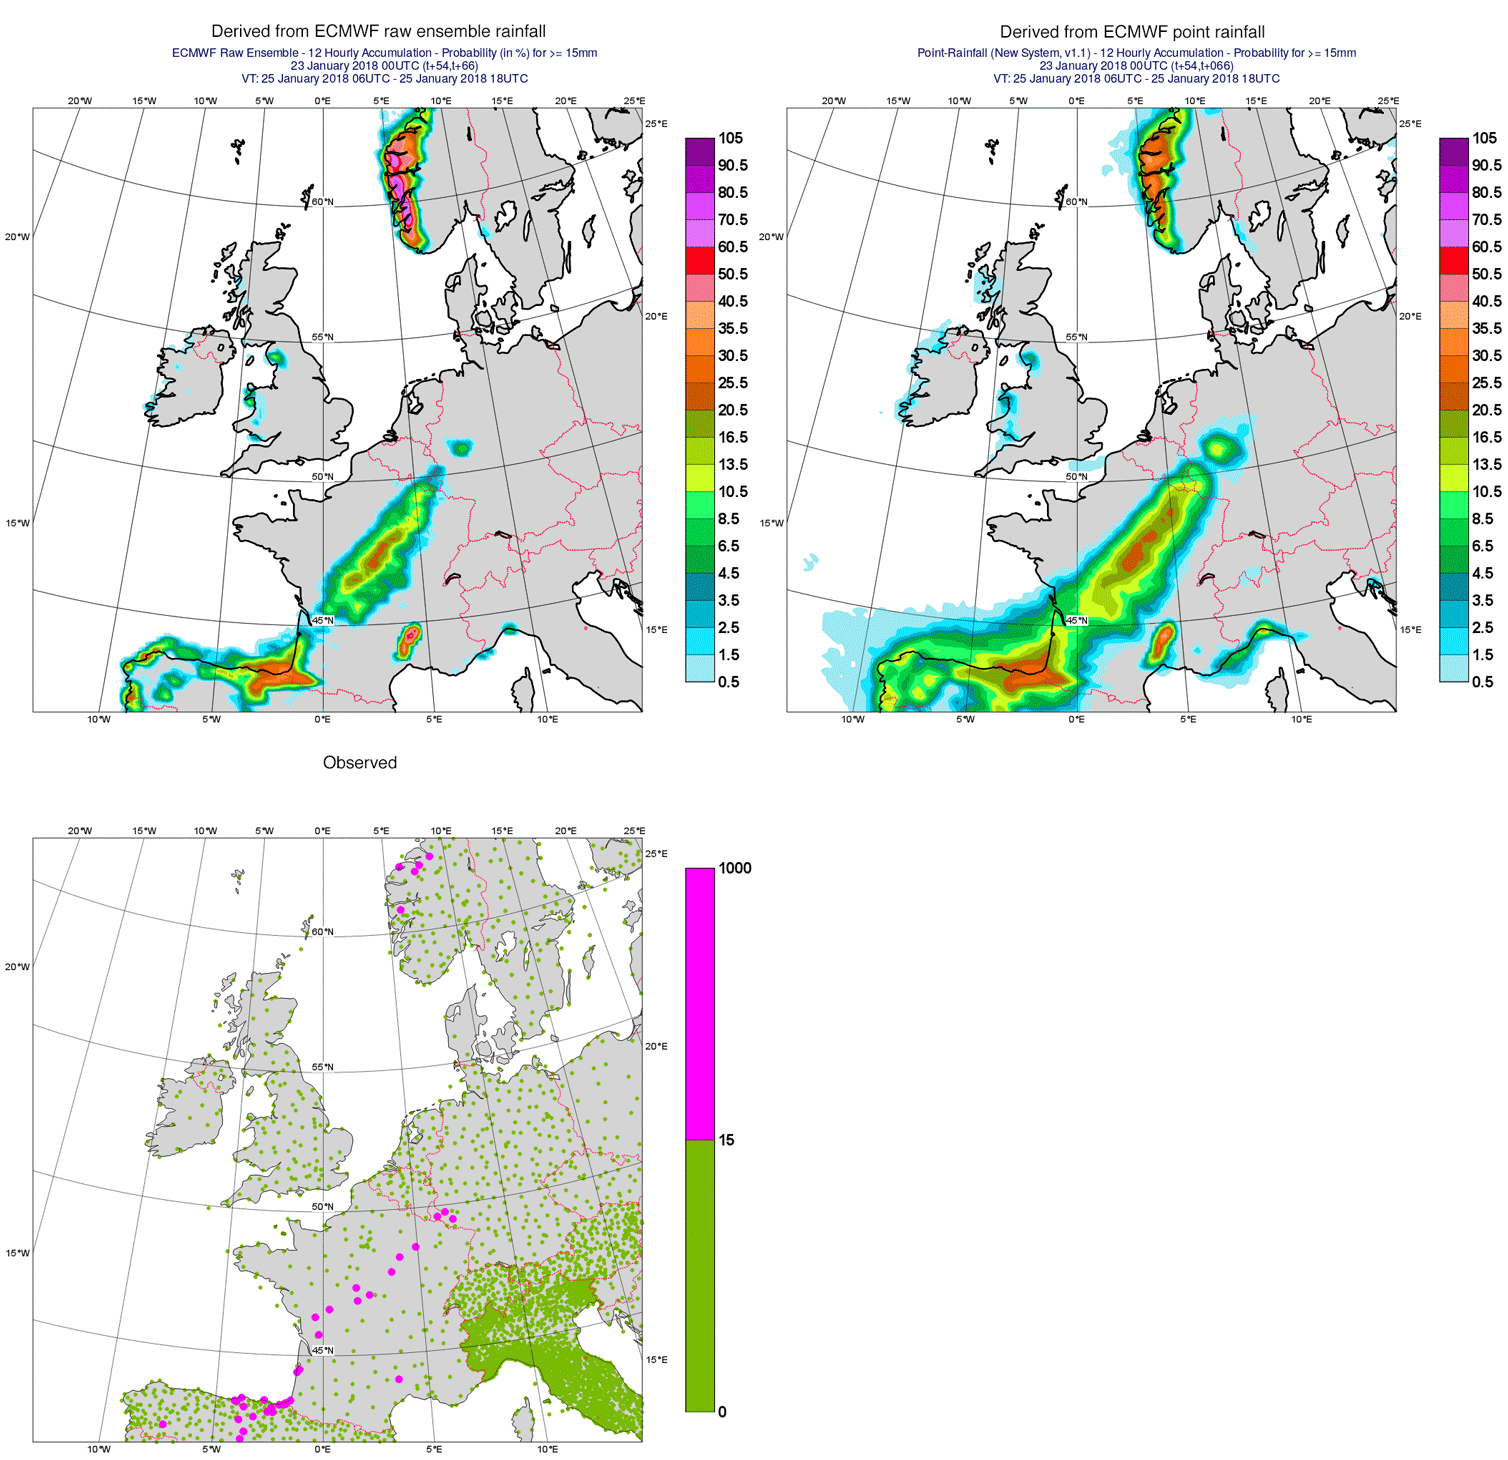
Here we show raw ensemble and point rainfall forecast probabilities of exceeding a 15mm rainfall threshold, and compare with point observations (pink dots show where >15mm was measured). The data are for forecast day 3 and rainfall accumulated over 12 hours. The increased probabilities seen for the point product over most of the southern half of the domain are largely due to sub-grid variability being expected. The reduction seen over southwest Norway is largely due to bias correction. The post-processing procedure is quite sophisticated; it utilises 214 different ways of mapping the raw ENS output onto point values, contingent on what weather type has been locally assigned to a grid box.
Future work
The development team at ECMWF would like to foster similar types of agreement with other national meteorological and hydrological services (NMHSs), and other data providers. Representatives of such organisations are invited to contact the team (for attention of Fatima Pillosu and Tim Hewson) and discuss how they could be part of this collaboration.
