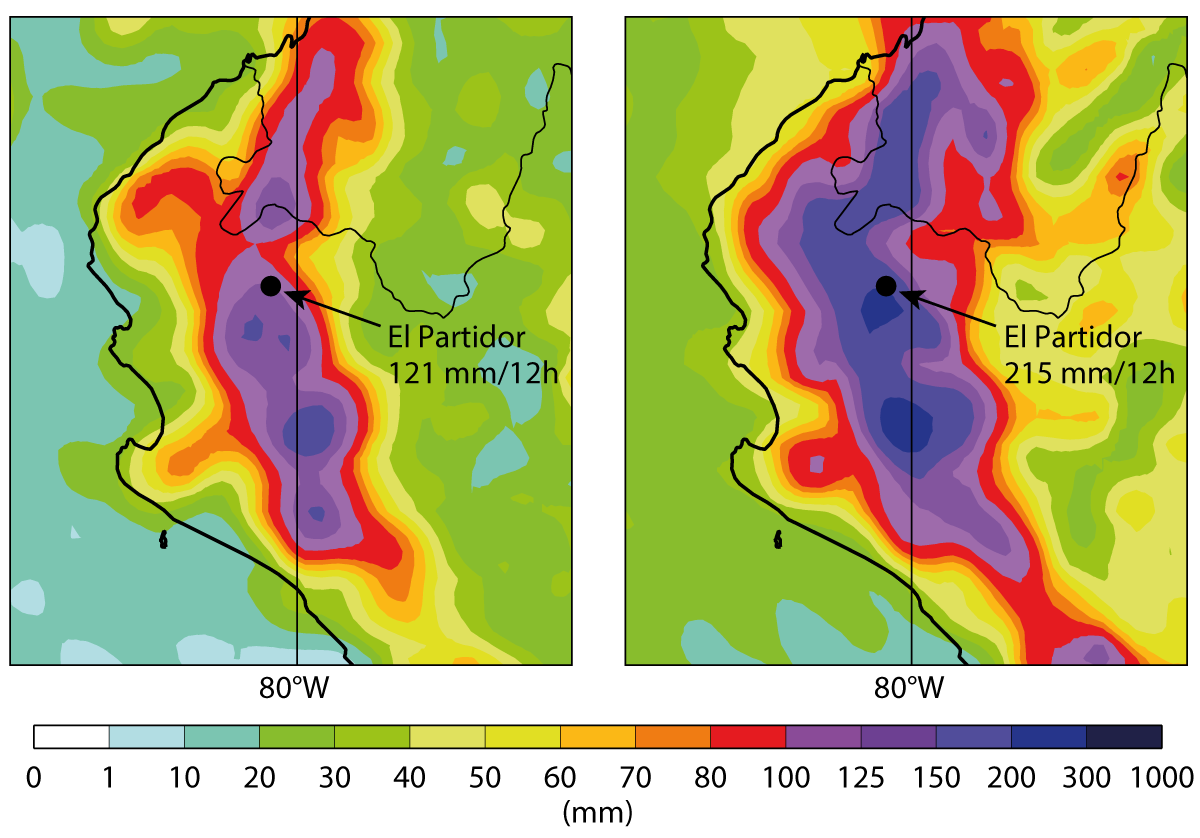
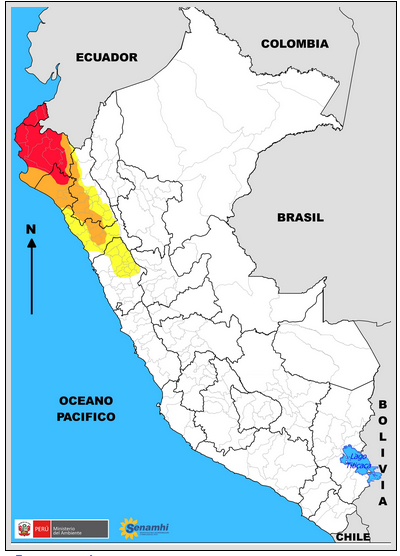
From March 2017, ECMWF provided Peru with its forecast products for a limited period of time to help the country deal with the exceptionally heavy rainfall it experienced in the first few months of the year. As early as 3 February, the government declared a state of emergency in all coastal regions. The most affected areas were in the north (Tumbes, Lambayeque and Piura). In Piura, several records for daily precipitation were broken: on 3 March in El Partidor, 258.5 mm was recorded; 121.6 mm was measured on 21 March in San Miguel; and between February and March in the area of Morropon 150 mm was exceeded on three occasions. In this area, in the past similar amounts have only been recorded during exceptional El Niño events, such as those seen in 1983 and 1998.
The rainfall led to rising waters in coastal ravines. In more southern mountainous regions, this led to what is known in Peru as ‘huaicos’, which are a mixture of water, mud and rocks. Several rivers burst their banks causing flooding and damage to housing and infrastructure in urban and rural areas; the failure of drainage systems; and disruption of the electricity supply and sewage treatment plants. As of 31 March, the disaster had left 101 people dead, 353 injured and 19 missing, while more than 200,000 homes had been destroyed or had become uninhabitable (figures from COEN, Centro Operaciones de Emergencia Nacional of the Peruvian Ministry of Defence).
Seasonal forecast
This anomalous rainfall is believed to be connected to warm sea-surface temperatures along the coast (a phenomenon called El Niño Costero), which were probably caused by an equatorial Kelvin wave in the ocean. This feature propagated from the Western Pacific, where it was first observed in the autumn of 2016 as a positive sea-surface height anomaly. Probably as a result of capturing the Kelvin wave early on, ECMWF’s seasonal forecast was able to predict the anomalous rainfall along the equatorial coast of South America. The forecast from 1 November 2016 showed a wet anomaly over the region in the February to April average.
ECMWF’s response
On 26 March, ECMWF received a request for rainfall forecasts from the environmental expert deployed from France (Institut national de recherche en sciences et technologies pour l'environnement et l'agriculture, Irstea) to Peru by the European Union Civil Protection Mechanism (EUCPM) through the European Civil Protection and Humanitarian Aid Operations (ECHO). Due to the exceptional circumstances, ECMWF agreed to provide its forecast products to the Peruvian Meteorological and Hydrological Service (SENAMHI) and COEN for a limited period of time, in accordance with our rules for the distribution of real-time data.
Access to all web products and ecCharts was granted and experts with previous knowledge of ECMWF products facilitated the uptake by local services. ECMWF established technical contacts with staff at SENAMHI and provided access to binary data in GRIB format in order to allow local services to process the information through their visualisation and impact models. Access to a new test product, Point-Rainfall, was also granted. It consists in statistical post-processing of ECMWF ensemble forecasts (ENS) to produce probabilistic rainfall forecasts for points. The idea is to provide better guidance in cases of localised extreme rainfall.

Use of ECMWF products
ECMWF web products helped SENAMHI forecasters to issue warnings of heavy rainfall that was likely to cause new flooding or to exacerbate existing flooding. Special attention was also paid to events that could hinder rescue operations and/or endanger rescuers’ lives.

The binary data was used to produce extreme precipitation forecast maps. The daily total precipitation forecast from ECMWF’s high-resolution forecasts (HRES) was combined with percentile maps generated from SENAMHI’s climatological and hydrological observations (PISCO), which is a gridded database for daily precipitation. The percentile maps showed the areas where the daily accumulated total precipitation (from 12 to 12 UTC) exceeded the 90th, 95th and 99th percentiles of the local climatology. This made it possible to highlight the areas facing a high risk of heavy rainfall and thus to issue corresponding warnings to COEN, the authorities, members of the Peru Disaster Risk Management System, the media and public users.
At the same time, ECMWF products were also used by the scientific team at COEN, who monitored the emergencies triggered by the precipitation and issued alert reports every three hours. ECMWF products were used alongside satellite images and local reports to enhance the accuracy of daily local rainfall forecasts and to enable better warnings of extreme rainfall and river floods. The use of forecast products by emergency teams in the field and during the early recovery phase not only improved preparedness for high-impact events but also helped to devise better-informed response plans. The cooperation with ECMWF has led SENAMHI to evaluate the possibility of acquiring a full NMHS (national meteorological and hydrological service) non-commercial licence to continue to have access to the full range of ECMWF forecast products.


