

The hot and dry conditions of 2018 brought serious impacts, with wildfires, health concerns, loss of agricultural crops and threats to water supplies. Image: Piotr Wytrazek/iStock/Thinkstock
Introduction
The heatwave this summer over much of Europe highlighted the value of ECMWF’s extended-range (sub-seasonal) forecasts. Looking two weeks ahead, the forecasts performed well and even out to four weeks the forecasts provided an indication of the warm conditions.
How long will the heatwave last? How much warning did ECMWF forecasts give of the heatwave conditions? These are the sort of questions we are trying to answer with our extended-range forecasts to enable us to provide effective guidance to our Member and Co-operating States.
An indication of weather conditions over the coming month is of great societal and economic value. Imagine the benefits for areas such as agriculture, weather-related disasters, water, energy and the retail industry.
While forecasting on monthly timescales is scientifically challenging, the skill of extended-range forecasts has grown steadily.
Extended-range forecasts – part of ECMWF’s seamless prediction system
ECMWF forecasts focus on three key timescales:
MEDIUM-RANGE forecasts give a detailed prediction of daily weather out to 15 days.
EXTENDED-RANGE (sub-seasonal) forecasts give a week-by-week indication of large-scale weather changes and potential unusual/extreme conditions such as hot/cold spells or periods of drought. The forecasts extend out to 46 days. Will there be a UK heatwave this month?
LONG-RANGE (seasonal) forecasts give advanced indication of seasonal conditions at large spatial scales, out to 7 months ahead. Will the coming winter over Europe be colder than normal? Will warmer conditions in parts of Africa next season increase the risk of malaria?
All ECMWF forecasts are produced from the Integrated Forecasting System. They use an ensemble of many forecasts to represent the uncertainty in the climate system and to provide information about the probability of future weather conditions.
The development of this “seamless prediction system” is giving ECMWF the ability to produce skilful, consistent forecasts from days to many months ahead.
The European heatwave of summer 2018
August 2018 was the hottest on record over Europe as a whole. This marked three months of well above normal temperatures, coupled in many parts with very little rainfall. The hot and dry conditions brought serious impacts, with wildfires, health concerns, loss of agricultural crops and threats to water supplies.
So, did the ECMWF extended-range forecast provide a warning of these conditions?
As an example, Figure 1 shows forecasts for the period at the end of July/beginning of August when temperatures reached their peak. A clear indication of above average temperatures can be seen in the forecast from the beginning of July (far right) (i.e. a whole month ahead). This information would have conveyed to users that the heatwave could well continue for at least another month and alert organisations to the potential of extreme heat during early August. When you look closely at the details, however, you can see that the anomalously warm temperatures in Spain and Portugal were not forecast.

Figure 1: 2m temperature anomalies (difference from normal) for the period 30 July to 5 August for analysis (left); forecast 3 weeks ahead (middle); forecast 4 weeks ahead (right). Units are °C. White areas are regions where the anomaly is not significantly different from zero.
Looking over a longer period from May to mid-August (Figure 2), the pattern of warmer than average conditions was predicted well when looking up to two weeks in advance. At three to four weeks in advance the forecasts give an indication of warm conditions, but underestimate their magnitude. The three- and four-week forecasts also fail to capture the warmer than normal conditions over Scandinavia.
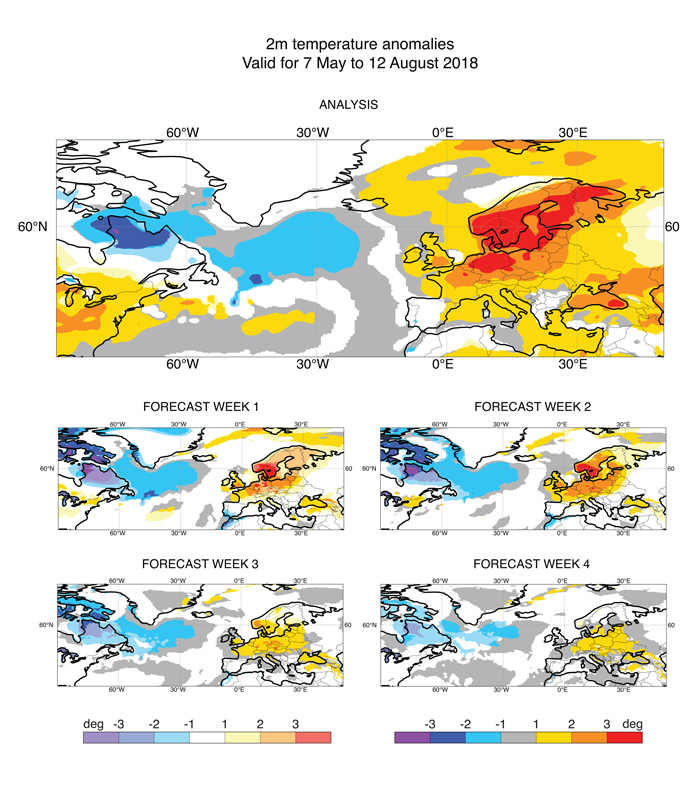
Figure 2: 2m temperature anomalies (difference from normal) for the period 7 May to 12 August for analysis (top) and composite forecasts valid for 7 May to 12 August, based on week 1 forecasts (middle left), week 2 forecasts (middle right), week 3 forecasts (bottom left) and week 4 forecasts (bottom right). Units °C. Saturated colours indicate significance at the 95% level.
The science of extended-range forecasts
Our ability to predict the weather on medium-range timescales is possible because the atmosphere retains a memory of the initial conditions. However, beyond a week or so, the skill of such weather forecasts begins to tail off rapidly. At the other end of our forecast range, the long range (seasonal) and beyond, the atmosphere is influenced by slowly varying ocean, cryosphere and land-surface conditions.
Extended-range (sub-seasonal) forecasts fall between the medium range and the long range, and hence represent a difficult scientific problem. In fact, until the 1970s it was thought that there was no predictability in the atmosphere at sub-seasonal timescales.
However, research since then has shown that there are aspects of the climate system that can provide some predictability, such as stratospheric conditions, soil moisture, snow, sea ice and sea-surface temperature and some large-scale weather patterns.
The importance of the Madden-Julian Oscillation
One particularly important source of predictability on monthly timescales is the Madden-Julian Oscillation (MJO) in the tropics. The MJO appears as an eastward travelling pulse of active convection and rainfall which takes around 30 to 60 days to propagate around the equator. It is strongest in the Indian and eastern Pacific and is quite irregular.
When the MJO is active, it can enhance the formation and strength of tropical cyclones. Importantly for monthly forecasting, the MJO also has an influence far beyond the tropics, including the North Atlantic and Europe.
A skilful extended-range forecast depends to a large extent on a skilful MJO forecast and ECMWF has seen a consistent increase in the skill of its MJO forecasts (see below).
Other sources of predictability on the sub-seasonal timescale include warming events in the high atmosphere (known as Sudden Stratospheric Warmings) which can be followed by easterly wind conditions over the North Atlantic and Europe. The land surface can also have an influence on surface temperature and rainfall over the following weeks, in particular the amount of moisture at the surface in spring and summer.
Producing the extended-range (sub-seasonal) forecasts
Extended-range forecasts have been produced routinely at ECMWF since March 2002. They currently consist of a 51-member ensemble produced from the same forecasting system as the medium-range forecasts which are extended twice a week out to 46 days ahead.
The extended-range forecast products focus on broad-scale, week-to-week weather conditions and are not designed to give information on the detailed day-by-day evolution of the weather. They are presented to users as averages over five to seven days.
Anomalies
Anomalies give users an indication of, for example, how much warmer/colder or wetter/drier than normal it might be over the coming month. Figure 3, for example, shows the ensemble mean 2m temperature anomaly for 6–12 February 2017, from a forecast which started on 23 January 2017.

Figure 3: Ensemble mean 2m temperature anomalies (difference from normal) for 6–12 February 2017 from a forecast on 23 January (i.e. looking 15 to 21 days ahead). Units °C. White areas are regions where the anomaly is not significantly different from zero.
Probabilities
Another important way to look at what might happen over the coming month is the forecast probability of, for example, colder/warmer than normal conditions (see example in Figure 4). A high probability of warmer than normal conditions (seen over much of central Europe and Scandinavia in Figure 4 for example) indicates that many of the ensemble members are suggesting warmer than normal conditions. Areas with probabilities closer to the 20–40% range indicate a wider spread within the ensemble and increased uncertainty about the up-coming conditions. As values fall further below the 20–40% range, there is increasing probability that temperature anomalies will not be above normal. Temperatures (and other variables) are divided into three categories (terciles): below normal, normal and above normal, hence these diagrams are known as tercile maps. The category levels are derived from the model climatology and defined as having equal probability in the climatological mean: below 33%, 33 to 66% and above 66% cumulative probability.

Figure 4: Probability that the 2m temperature will be above normal, taken from day 19 to 25 of a forecast valid for 13–19 February 2017. The probability range 20–40% is not coloured, in order to indicate regions where the model does not predict a significant shift of ensemble distribution from the model climatology.
A forecast with high probability of warmer than normal weather in three or four weeks' time might, for example, guide a supermarket to prepare for extra stocks of ice cream or suggest to farmers that crops might need irrigating in the coming weeks. Of course, how different users act on such forecast information depends on the details of how they operate, the risks involved for them, the repercussions of acting/not acting, as well as the details of the forecast itself.
Tropical cyclones and other extended-range products
ECMWF extended-range forecasts also provide information about tropical cyclone frequency and likelihood of a tropical storm strike, both calculated over weekly periods.
Other extended-range products include further details about the ensemble members, the evolution of large-scale flow and the MJO. There is also, for Europe, a multi-parameter outlook which displays geopotential height at 500 hPa (indicating large-scale circulation) and anomalies of 10-metre wind, 2-metre wind and sunshine duration.
How skilful are ECMWF extended-range forecasts?
Imagine again the supermarket trying to decide on stocks of ice cream for the summer. Without an extended-range forecast, they might base their decisions on the typical weather conditions (called “climatology”) during summer or users might assume that the weather conditions over the previous few weeks will continue (called “persistence”).
The “climatology” is typically calculated from the mean conditions over a period of 20 or 30 years in the recent past. Looking at how the forecast differs from the model climatology shows us how different the forecast is from the model’s average conditions.
The skill of extended-range forecasts is often compared with the skill of using “climatology” or “persistence”: the ECMWF extended-range forecasts perform better than both.
We can also look at the skill of ECMWF’s MJO forecasts, which as explained above, is a key source of predictability on extended-range timescales. ECMWF has seen a consistent increase in the skill of its MJO forecasts (Figure 5). If we look at a correlation of 0.6, ECMWF can now provide forecasts of the MJO out to four weeks ahead, while back in 2002 we had comparable skill only out to about two weeks. So, predictability has advanced by two weeks.

Figure 5: Evolution of the skill limit of the ECMWF extended-range forecasts of the Madden-Julian Oscillation (MJO) since 2002. Skill is measured as the forecast day when the correlation between forecast and analysis falls to 0.5 (blue curve), 0.6 (red curve) or 0.8 (brown curve).
The extended-range forecasts will not always give the right indication to users. However, overall they provide a better indication than simply using the normal/typical conditions for the time of year (climatology) or using persistence of the current conditions, so can provide useful guidance.
Coming back to the ice cream and crop irrigation examples, there would be occasions when the extra stocks of ice cream might go to waste and be a cost to the supermarket, or farmers might prepare to irrigate crops and find that in reality there is plenty of rainfall. However, over time the ECMWF extended-range forecasts would provide better guidance than using normal conditions or assuming persistence.
How are ECMWF extended-range forecasts being used?
Supermarket ice-cream stocks and agricultural irrigation provide illustrative examples, but there is a growing and urgent need for the use of extended-range forecasts for a wide range of applications, such as:
- warnings of severe, high-impact weather to protect life and property
- humanitarian planning and response to disasters
- river-flow forecasts for flood prediction, hydroelectric power generation and reservoir management
- agricultural applications such as irrigation and pesticide application
- the energy sector, wind energy for example.
The future
ECMWF has seen long-term improvements in the skill of its extended-range forecasts and more recent improvements with the new model version introduced in June 2018.
Research is actively seeking to improve skill further. Areas being looked at include understanding and modelling the processes that control sub-seasonal variability and the links between the MJO and the extra-tropics. Some situations (e.g. when there is an active MJO) can produce more skilful monthly forecasts. Researchers are trying to understand and provide guidance to users on these so-called “forecasting windows of opportunity”.
Despite their clear economic and societal value, evidence suggests that extended-range forecasts are currently under used across a wide range of sectors. So, future progress depends on BOTH improving forecast skill and working closely with users in order to reap the benefits that forecasting on the extended-range timescale can bring.