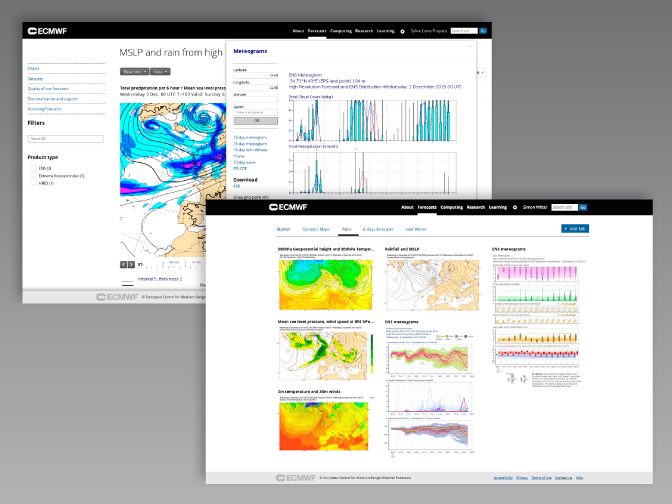

December 2nd marks a major milestone for ECMWF’s website: it now offers new and improved versions of all our web charts and tools.
At the same time, a new reduced-fee licence is available to give more national weather services access to the full range of charts.
Since we launched this website early in 2014, we have been steadily extending the range of products available, redesigning and adding to those that were available on our old site.
The latest set of updates includes forecast charts for tropical cyclones and severe weather demonstration projects, as well as charts for monitoring the quality of observations and for our monthly and seasonal forecasts.
We have also launched a ‘Chart dashboard’ for organising regularly used charts and diagrams, and an ‘eLibrary’ containing publications such as the ECMWF Newsletter and workshop proceedings.
All content from the old site has now been either migrated or archived.
Forecast charts and ecCharts
The ‘Charts’ section of the website now contains the full range of ECMWF charts, including ensemble meteograms (formerly EPSgrams) and charts for the Extreme Forecast Index, tropical and extra-tropical cyclones, and ocean waves.
We have completely redesigned the way web charts are produced and displayed, with usability at the centre of the design process. The wider display, for instance of the tropical cyclone charts, gives users a better overview.
Some charts are now interactive, with users able to view point forecasts for anywhere in the world, in several different formats, through a ‘clickable map’ interface. These charts are available for 29 different domains spanning the world, and including oceanic regions.
The faceted search makes it easier for users to find charts by applying different filters, such as ‘high-resolution’ or ’temperature’. We will continue adding to and refining these filters in response to user feedback.
The new ‘Chart dashboard’ is a place for organising regularly used charts and diagrams, allowing users to compare maps and follow the different forecast steps. It builds on the ‘Your Room’ service that was available on the old website.
This dashboard is integrated with the ecCharts dashboard. ecCharts is a suite of interactive web applications designed to help forecasters in their daily work. It now provides a web user interface to browse, customize and overlay ECMWF forecast products and a standard web service that enables the integration of graphical products in the forecaster’s working environment.
New licence
Most charts are available only to registered users in Member and Co-operating States, and to other licensed users. To enable more national weather services, primarily those from developing countries, to benefit from our full range of web-based charts, we have recently introduced a reduced-fee licence for NMHSs that are members of the WMO.
