
On 14 July, parts of western Germany, north-eastern France, eastern Belgium, the eastern Netherlands and Luxembourg were hit by extreme rainfall leading to devastating flooding in small and medium-sized rivers, such as the Meuse and Ahr. The event caused more than 200 fatalities in Germany and Belgium. In this article, we discuss (i) how extreme the event was in the ERA5 reanalysis from the Copernicus Climate Change Service (C3S) and (ii) predictions of the event in ECMWF precipitation forecasts. However, rainfall predictions are only a part of the forecast value chain, which reaches from observations and numerical weather forecasts, via hazard and impact modelling, to public warnings and ultimately actions, and there are many aspects not covered here.
Meteorological background
The event was connected to an upper-level trough that caused extreme weather from the UK to Romania during its propagation from the Atlantic to south-eastern Europe. In the days leading up to the event, Switzerland, south-western Germany and eastern France also saw heavy precipitation. From 13 July to the early morning of 15 July, exceptional rainfall occurred on the north-western side of the cut-off low, in the warm and moist air stream from the north-east. This led to extreme amounts of rain on the eastern side of the low mountain ranges on the border between Germany and Belgium. Several stations on the German side measured more than 150 mm/48 h. In eastern Belgium the observation coverage is sparse in the ECMWF verification system, but according to the Royal Meteorological Institute of Belgium the town of Jalhay received 271 mm and Spa 217 mm over the same period.

Rainfall
For the evaluation, we focus on rainfall from 13 July 06 UTC to 15 July 06 UTC in a box (50–51°N, 5.5–7°E) covering the eastern part of Belgium and the worst-affected region in Germany, and also small parts of the Netherlands and Luxembourg (see the ERA5 precipitation map). The first question to ask is how extreme this event was in a historical perspective. To answer this, we make use of nearly 72 years of ERA5 precipitation data as a proxy for observations. Precipitation totals for the box have been calculated for all 48‑hour intervals since January 1950, with steps of one day. The 48‑hour window starting at 06 UTC on 13 July 2021 has by far the heaviest precipitation, with 104 mm (see the ERA5 precipitation distribution chart). The value is almost twice what was previously the heaviest precipitation in the period since 1950 (excluding the overlapping 48‑hour interval starting on 06 UTC on 14 July 2021).
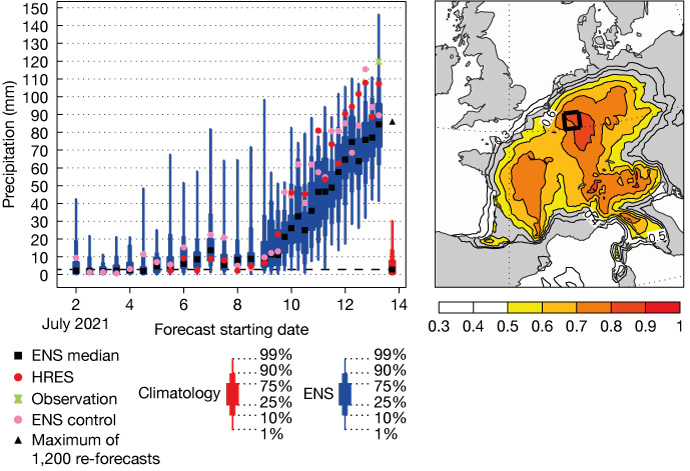
Looking at the prediction of the event, the ensemble forecasts from 10 July for the same region started to pick up a signal of significantly wetter than normal conditions (see the box-andwhisker plot). At this time, the 3‑day Extreme Forecast Index (EFI) gave a broad-scale signal over western Europe, with the strongest signal over western Germany (see the EFI chart). From 11 July 00 UTC onwards, the ensemble median was above the 99th percentile of the model climate for the 48‑hour event discussed above. In the last ensemble forecast (ENS) before the event, the ensemble median was about the same as the maximum found in ECMWF’s 1,200 re-forecasts based on day 5–7 forecasts over the past 20 years valid at the same time of year, and with much higher precipitation in some ensemble members. The predicted area-average precipitation in the last high-resolution forecast (HRES) before the event (107 mm) was somewhat lower than the average over the stations in the box (120 mm). However, looking at the observation map, with a gap in available observations for the worst-affected region in Belgium, it is likely the real area-average precipitation was higher, and it is therefore plausible that the ECMWF forecasts underestimated the quantity (see the observation map and short-range forecast for 48‑hour precipitation).

Water absorption and runoff
The intense rainfall over steep valleys caused the most devastating and fastest developing flood waves, causing considerable destruction in towns such as Schuld, Altenahr and Dernau on the River Ahr, a small tributary of the Rhine. The complex terrain and local geology have been highlighted as contributing factors to the severity of the event. The mountains in the region are quite low but relatively steep, and the soil on top of the bedrock is very thin, both factors leading to a rapid runoff into rivers. The local scale complexity challenges the soil model in terms of distributing the predicted precipitation between local storage and runoff into rivers and ground water. In the shortest HRES forecasts, the ECMWF Land Surface Modelling System (ECLand) in the Integrated Forecasting System (IFS) predicted up to 20–25% of the total rainfall in the box to directly go into runoff, while the rest of the water was absorbed by the soil locally. While this quantity is very hard to observe under these conditions, the prediction is likely to be an underestimation. Currently, separate soil models are used for numerical weather prediction (NWP) and flood forecasting purposes at ECMWF. Plans for kilometre-scale soil modelling in the IFS include making the model more suitable for predicting runoff by increasing the number of levels in the soil model and having a more integrated approach between NWP and hydrological forecasting. The long-term aim is to achieve a calibrated set of hydrological parameters that simultaneously improve evaporation into the atmosphere, long-term memory in the soil, and river discharge forecasts on both slow timescales, e.g affecting the freshwater flux into oceans, and a fast timescale to predict flash-floods like the event described in this article.
Flood forecasts
The ECMWF HRES and ENS, together with forecasts from the German National Meteorological Service (DWD) and COSMO-LEPS (the Limited Area Ensemble Prediction System developed by the COSMO consortium), are used in the European Flood Awareness System (EFAS) of the Copernicus Emergency Management Service (CEMS). The EFAS system provides forecasts for discharge in medium-sized and large rivers, and flash-flood forecasts for small rivers. ECMWF is the computational centre of EFAS, which issued flood forecasts for this event.
A detailed evaluation of the EFAS forecasts for this event is currently being undertaken in collaboration with other EFAS centres and the Joint Research Centre (JRC) of the European Commission, and will be presented at a later stage.
Conclusion
The magnitude of rainfall in the worst-affected region broke the record in the ERA5 reanalysis by a large margin. ECMWF forecasts predicted an extreme event with high confidence 3 days before the start of the 2‑day event, but with large uncertainties about the absolute magnitude and how the rainfall would translate to runoff into rivers.