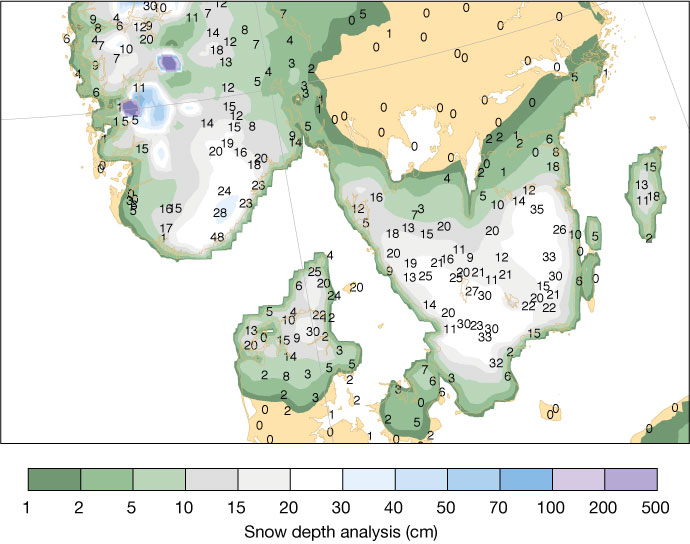
The end of November and the beginning of December 2021 were much colder than normal in northern Europe. During the period, a sequence of cyclones brought challenging weather conditions for several countries. Over the British Isles, storm Arwen caused strong winds and snowfall, leading to long power outages locally. Here, we will focus on a cyclone that passed Denmark and southern Sweden on 1 December and brought up to 30 cm of snow in northern Denmark and inland parts of southern Sweden (see the snow depth analysis and observations).
Precipitation forecasts
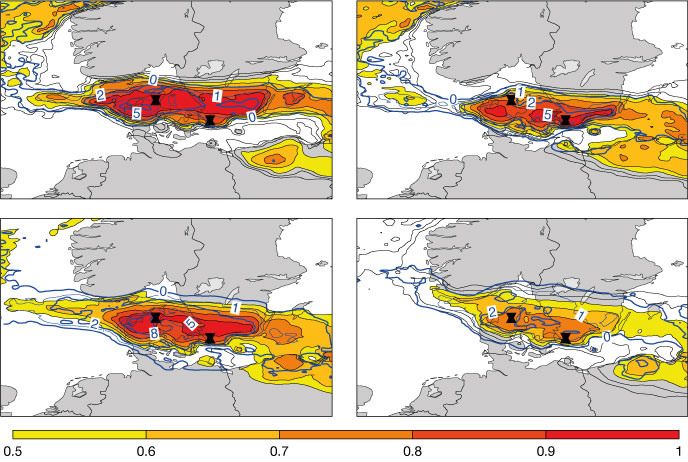
In terms of medium-range predictions, ensemble members started to pick up the risk of snowfall on 26 November, five days before the event. The signal became gradually stronger in forecasts from 28 November onwards, as can be seen in the Extreme Forecast Index (EFI) and Shift of Tails (SOT) figure. However, for northern Denmark the EFI for snowfall dropped in the forecast from 30 November before re-gaining strength again just before the event. As this dip occurred, the SOT forecast maintained relatively high levels (>2), indicating that the possibility of an extreme event was still very much there. This case can serve as a reminder to forecasters to not extrapolate trends in consecutive forecasts.
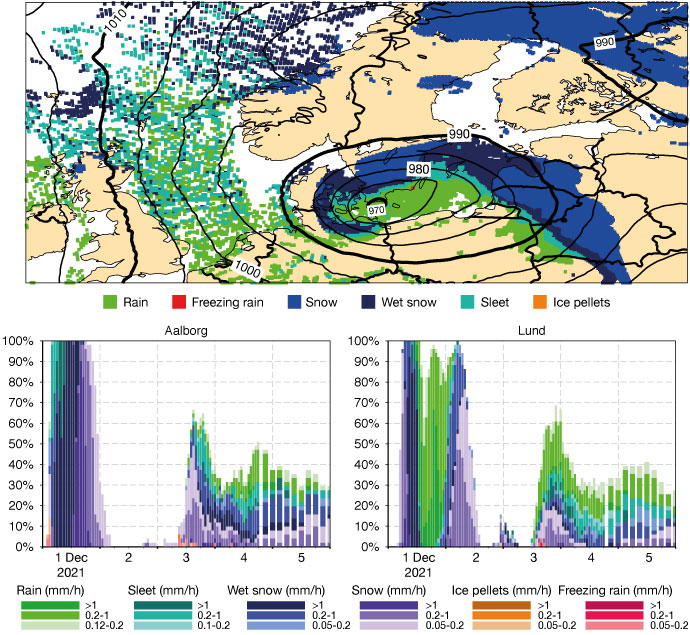
ECMWF provides various precipitation-type products based on the model output. Here we show the 24‑hour high-resolution forecast (HRES) valid on 2 December at 00 UTC together with five-day precipitation-type meteograms for Aalborg in northern Denmark and Lund in southern Sweden, all starting on 1 December at 00 UTC. The products show, respectively, the diagnosed precipitation type in HRES and probabilities of each precipitation type from ENS, distinguishing in each case between rain, sleet, wet snow, snow, ice pellets and freezing rain. The ensemble product also includes three different intensity categories. During the cyclone passage, precipitation mostly fell as snow on the northern side, as was the case for Aalborg, where the forecast indicated wet snow for most of the time. On the southern side, the precipitation started as snow, then turned into rain in a warm sector of the cyclone, but then turned back to snow again later as the cyclone moved on.
Snow on the ground
A critical question for the impact is how much snow will accumulate on the ground. The complex evolution of the precipitation type going from snow to sleet to rain and then back to snow again makes the modelling of snow accumulation on the ground challenging. The ECMWF model has a known issue with the accumulation of snow on the ground when the precipitation type falls as sleet: the fraction of snow included in the sleet tends to erroneously accumulate on the ground in the model. A second known issue that makes this type of situation worse is that, once there is any snow on the ground in the model, it tends to melt too slowly. This problem is most acute when the total diagnosed depth is small. These issues are documented for users as items S2 and S3 here: https://confluence.ecmwf.int/display/FCST/Known+IFS+forecasting+issues. Both came to the fore in the forecast for Lund from 1 December 00 UTC. The model accumulated 5 cm of snow (10 mm of water equivalent), which then reduced to 4 cm only five days into the forecast. In reality, 2 cm was measured on 2 December at 06 UTC, and that all melted later that day. Such errors in accumulated snow can impact the 2‑metre temperature further into the forecast range, especially during clear-sky situations leading to strong cooling over snow surfaces.
Of course, the prediction of accumulated snow on the ground is critical for users. How well did the short-range forecast do for predicting the precipitation and accumulated snow in Aalborg? The total 24‑hour precipitation forecast for Aalborg for 1 December in the shortest-range forecast (from 00 UTC that day) was 32 mm, of which 30 mm was predicted to be in snow form. The resulting snow depth is then a function of the accumulated snow water equivalent and the modelled snow density. The latter adds another dimension of complexity in the modelling. The modelled snow depth increase during the period was 16 cm, indicating a relatively high snow density for fresh snow. Meanwhile, nearby observations reported 17 mm of precipitation in 24 hours, and a snow depth increase of 20 cm. Thus, whilst the predicted total precipitation was almost twice the observed value, the predicted increase in snow depth seems to have been lower than observed. This discrepancy could be due to either overprediction of the snowfall accompanied by an overestimation of the snow density, or an under-catchment of snow in the rain gauge, resulting in a precipitation observation value that is too small. The latter is a common observation problem when heavy snowfall is accompanied by strong winds.
Cycle 48r1 of ECMWF’s Integrated Forecasting System (IFS) is to include a major upgrade of the snow scheme in the land model. This will include improvements to the thermodynamics, which are expected to bring a number of benefits such as better melting of low snow amounts, although further work is needed to solve all issues related to snow accumulations.