The eruption of the Hunga Tonga–Hunga Haʻapai volcano in the southern Pacific Ocean on 15 January 2022 had a strong effect on the signals of several satellite instruments used by ECMWF, both for numerical weather prediction (NWP) and atmospheric composition. As widely reported at the time, this was a powerful eruption that could be heard thousands of kilometres away. At the time, signals evaluated by ECMWF showed that the plume rose higher than 20 km.
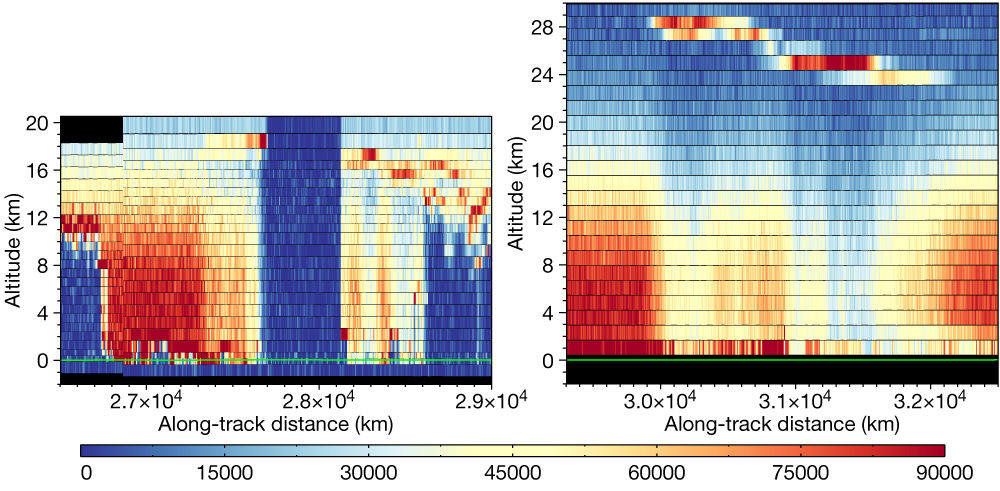
Atmospheric impacts of volcanic eruptions are most clearly observed in terms of the ash column, which in the case of Hunga-Tonga was observed in satellite imagery to reach well into the stratosphere and beyond (https://earthobservatory.nasa.gov/images/149474). Particulate matter in the ash column was first detected as a significant reduction in measurements from the European Space Agency’s Aeolus satellite, which uses the amplitude of back-scattered lidar pulses at 355 nm by aerosol particles (and clouds and air molecules) to profile atmospheric winds using the Doppler frequency shift. The top altitude of the Aeolus measurements, at 21 km, was below the altitude of the ash plume, causing the total attenuation of the lidar pulses. The range of the Aeolus measurements was raised to 30 km later in January, after which the satellite’s cloud observations clearly reflected the location of the ash plume in the stratosphere (see the Aeolus figures).
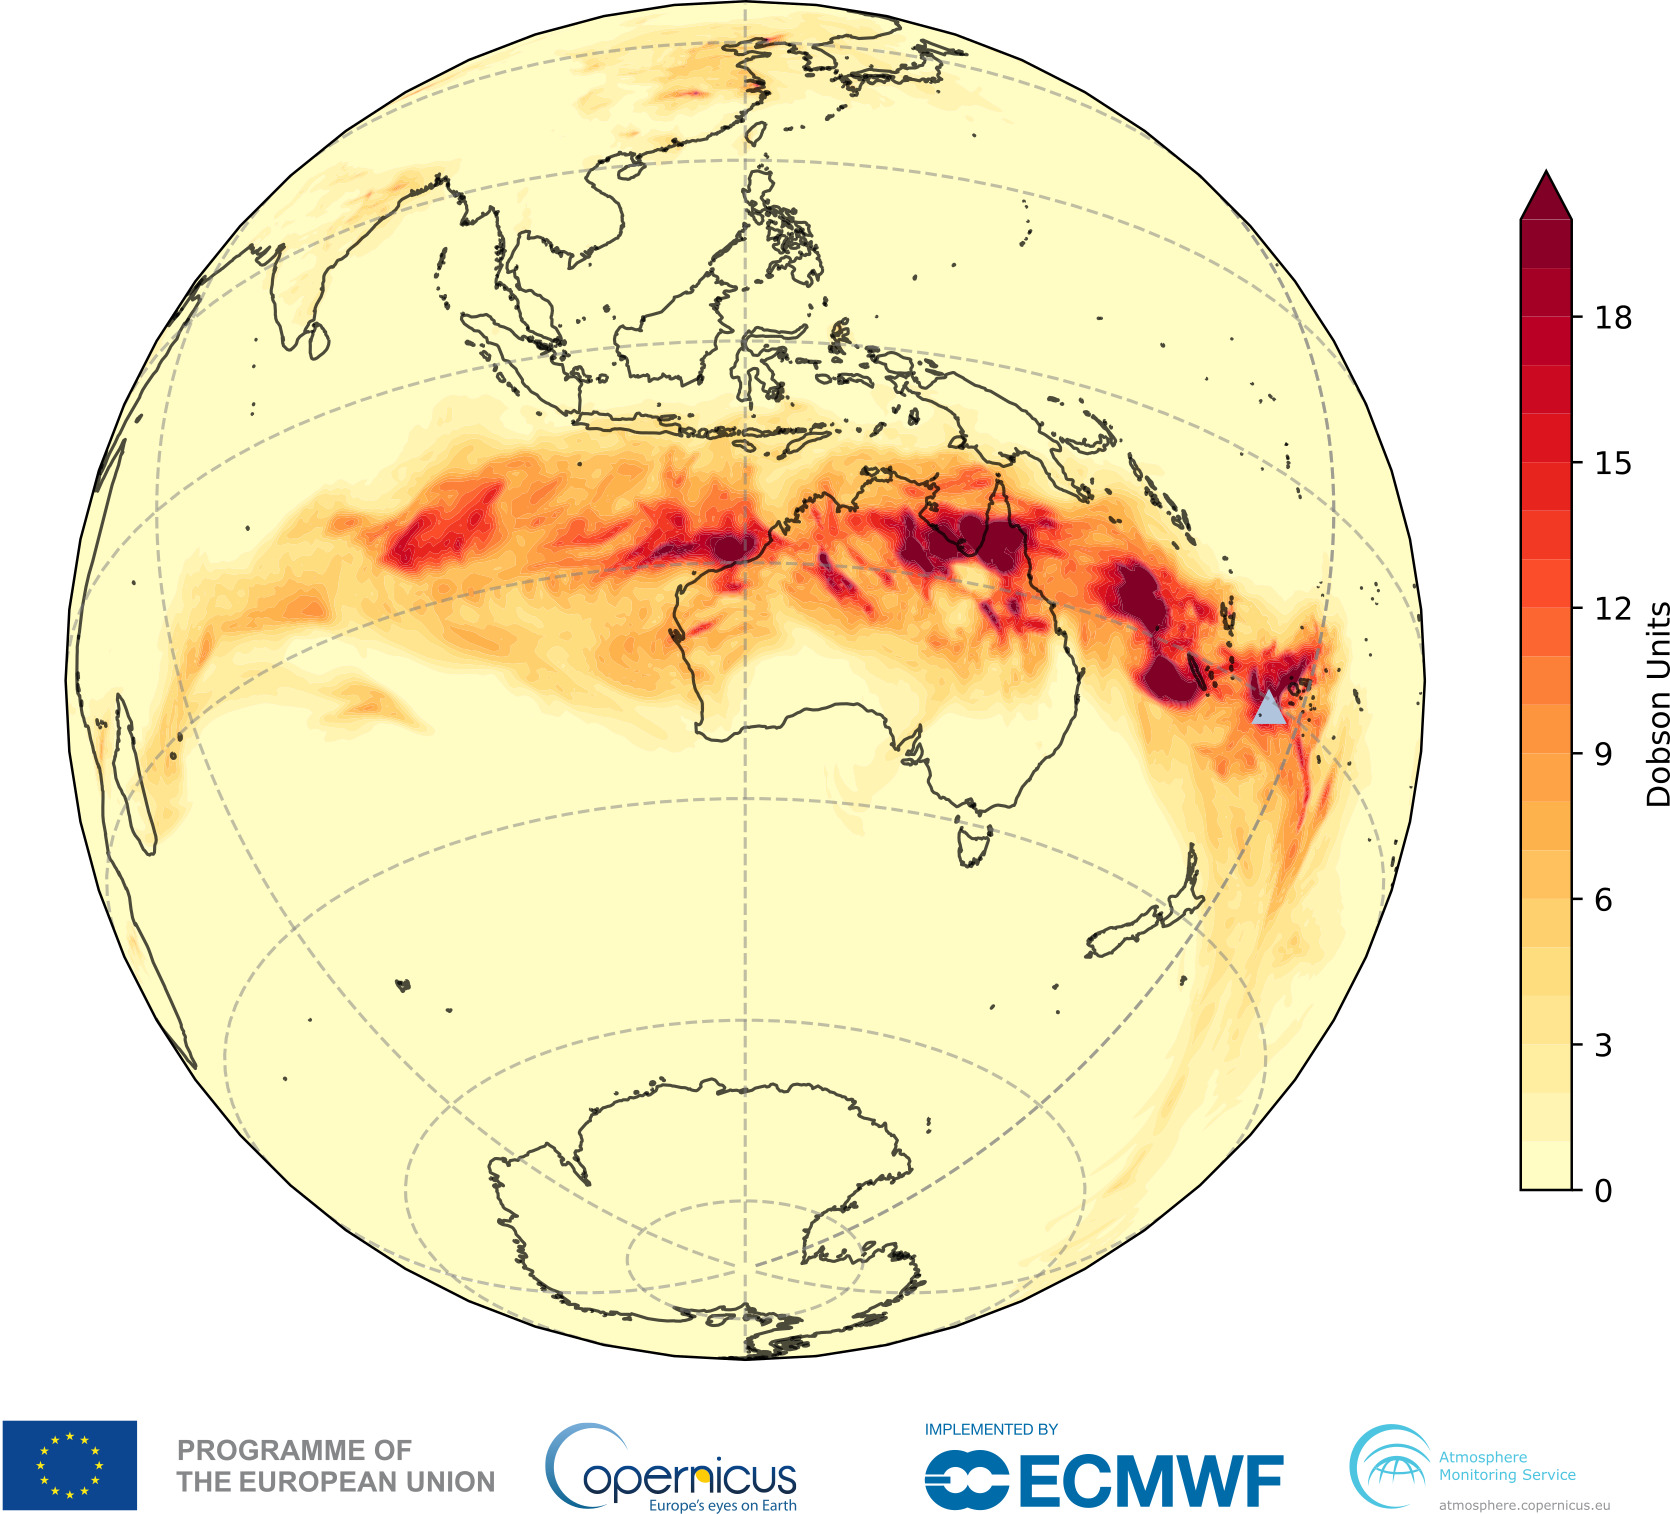
Another atmospheric impact of volcanic eruptions is through emissions of sulphur dioxide (SO2). Total column SO2 abundance in the atmosphere can be detected by the Metop/GOME-2 and Sentinel-5P/Tropomi satellite instruments using observations of back-scattered solar radiation at ultraviolet and visible wavelengths. The Copernicus Atmosphere Monitoring Service (CAMS), implemented by ECMWF for the EU, assimilates satellite observations of total column SO2 in ECMWF’s Integrated Forecasting System (IFS) following a volcanic eruption to provide analyses and forecasts (see Inness et al., https://doi.org/10.5194/gmd-15-971-2022). It observed the transport of SO2 initially across the South Pacific and later across Australia and the Indian Ocean as far as southeastern Africa. Accumulating the maximum CAMS total column SO2 analysis values between 16 and 22 January reveals the large-scale extent of the plume transport across the South Pacific and Indian Ocean. In addition to SO2, CAMS also provides information on sulphate aerosol, which can be formed chemically from SO2. It monitored sulphate aerosol in the troposphere during its transport and found a clear signal in aerosol optical depth following the SO2 transport across the Indian Ocean, where it was also detected in ground-based observations from the NASA Aerosol Robotic Network (AERONET) site in La Reunion.
Further impacts of the eruption were apparent in other observations used for NWP at ECMWF. These included temperature channels from microwave and infrared satellite observations. Perturbations to these channels were clearly detected in the first-guess departures when assimilated in the IFS (see www.ecmwf.int/en/about/media-centre/news/2022/hunga-tonga-eruption-seen-ecmwf).
The Hunga-Tonga eruption was a unique event both in terms of its destructive nature to Tonga and surrounding islands and in the way its impacts were observed by a large proportion of the global observing system. While some of these observations were indirect, the measurements related to SO2 and atmospheric aerosols provided valuable information to understand the larger-scale impacts on the atmosphere and how they subsequently evolved.