ECMWF’s weather predictions rely on global weather observations to help determine the initial conditions of forecasts. A key question for the evolution of the global observing system is how much benefit we expect from new observing capabilities. To answer this question, ECMWF is closely working together with space agencies, and we are increasingly using ensemble methods to estimate expected impacts from potential future satellite missions. A key tool is the Ensemble of Data Assimilations (EDA), which estimates in a statistical sense the expected reduction of uncertainty in the forecast from adding observations to our forecast system. The tool was first used 15 years ago to predict the impact of wind profile observations from the Aeolus satellite mission, which was being planned at the time. It was subsequently applied to gauge the benefit of an increase in available radio occultation data. With both of these observing capabilities becoming a reality in recent years, we are finding that the predictions from many years ago are relevant indicators of the actual impact now obtained. We can also use these new observations to further evaluate the strengths and limitations of the EDA method. Looking again into the future, the EDA method is now being used to assess the value of more passive microwave (MW) sounding observations, demonstrating continued strong benefits from an increase in the number of available MW sounders. The findings help space agencies such as the European Space Agency (ESA) and the European Organisation for the Exploitation of Meteorological Satellites (EUMETSAT) to design an impactful and cost-effective constellation.
EDA method
The EDA uses a Monte-Carlo approach to estimate the size of short-range forecast error statistics. Multiple data assimilation computations are run in parallel, with perturbations added to the observations and other input parameters (e.g. sea-surface temperature) as well as to the forecast model. If these perturbations are chosen appropriately, it can be shown that the spread of the ensemble is related to the statistical uncertainty in the analysis and short-range forecasts. At ECMWF, the main role of the EDA is to provide flow-dependent uncertainty information for the short-range forecast (background) used in the operational numerical weather prediction (NWP) assimilation system and to help initialise predictions of ensemble forecasts. However, Tan et al. (2007) realised that both real and simulated observations could be included in the EDA at the same time. This means that we can assess how new, simulated observations change the EDA spread, and hence how they reduce the statistical uncertainty in analyses and short-range forecasts. The new observations are simulated from a representation of the actual atmosphere, such as the ECMWF high-resolution analysis. Perturbations are added to the simulated data to mimic expected errors in the measurements, for instance arising from instrument noise.
The EDA method is conceptually quite different from more traditional Observing System Simulation Experiments (OSSEs), which are also used to gauge the expected impact from a future observing system. OSSEs start from a long run of the forecast model, the so-called ‘nature run’, which simulates the true evolution of the atmosphere. All observations and their error characteristics are simulated from this nature run, and these are subsequently assimilated as if they were real observations. New observations can also be simulated from the nature run, and assimilated alongside the existing observations, and so the impact of new data can be assessed. Ensuring that all existing observations are simulated in a realistic way is a very significant effort. The EDA method has the advantage that real observations can be used alongside simulated ones, and the method directly benefits from any refinement, made for the EDA, used in the background-error modelling in the operational NWP system. While ECMWF provides nature runs to support OSSEs performed at other organisations, we currently use the EDA method for assessing new observations.
Previous impact predictions
The EDA method was first used 15 years ago in an ESA-funded study to predict the benefit expected from line-of-sight wind-profile information from the Aeolus Doppler wind lidar satellite mission. The study suggested that we would see a clear positive impact from the assimilation of Aeolus data, with particular benefits in the tropical troposphere and over oceans. This significant impact was largely confirmed a few years ago when real Aeolus data became available, at least in a qualitative sense. The underlying observing system and the ECMWF assimilation system of course changed considerably in the meantime, making a strict quantitative one-to-one comparison impossible. But overall the impact of the real data showed many of the characteristics of the earlier predictions. This underlines that the EDA method can indeed provide useful guidance on which observations will make a big impact in the global observing system, and it can indicate where this impact will be strongest.
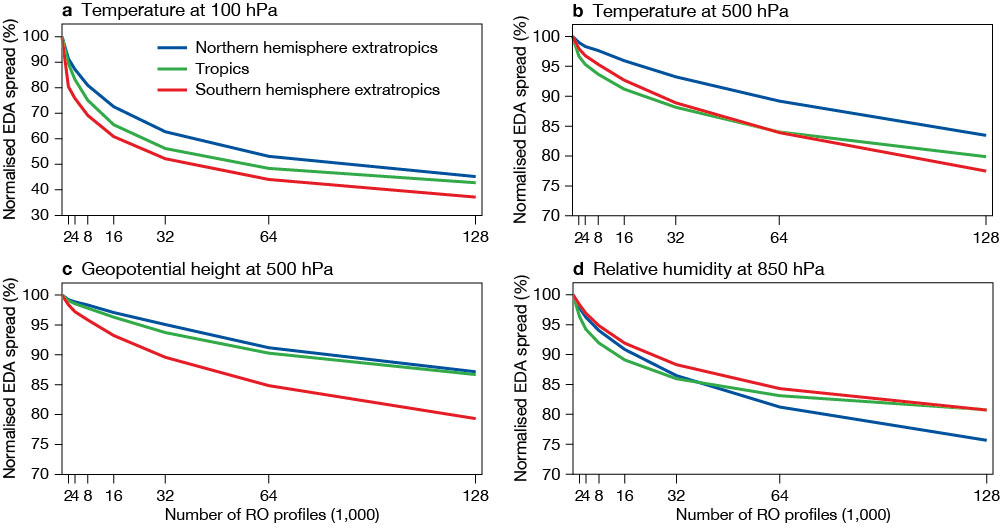
Another previous application of the EDA method suggested in 2013 that we would see very significant benefits from an increased number of radio occultation (RO) observations. These measurements provide primarily information on temperature and humidity at high vertical resolution, and they play an important role in controlling bias corrections for other satellite observations. At the time the EDA-based predictions were made, RO was a comparatively new observation type with relatively few observations available, and it was unclear how their impact would scale with more available observations. Surprisingly, the study indicated continued positive impact when increasing the number of RO observations per day beyond the 2,500 observations available at the time even out to 128,000 (Figure 1), with the clearest benefit for the first 20,000 profiles (see Healy et al., 2013). This gave strong motivation to invest in increasing the number of RO measurements made. In recent years, the number of real RO observations has indeed increased very significantly, particularly through the introduction of COSMIC‑2 data and access to Spire observations. This has resulted in a very significant improvement in the impact of RO observations on forecasts, in line with previous predictions (see Lonitz et al., 2021).
Verifying previous impact predictions for radio occultation data
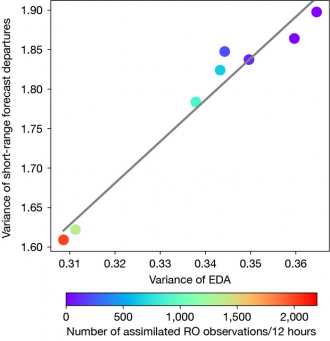
The new RO data has also allowed us to revisit some specific aspects of earlier predictions to further test the behaviour of the EDA method. Firstly, we looked at how actual short-range forecast error statistics change as the number of RO observations increases, and we compared this with EDA spread reductions. One example is shown in Figure 2, for temperatures at 100 hPa in the tropics. As the number of RO measurements increases, the short-range forecasts fit radiosonde temperature measurements more closely and the EDA spread values are reduced. This illustrates the link between spread-reduction and forecast improvement, as expected. The differences between radiosonde values and short-range forecasts are affected by measurement and representation errors, so a perfect one-to-one relationship is not expected. What is more important here is that the different impact results appear to follow a linear relationship, suggesting a strong link between the two measures. The slope of the linear relationship is larger than one, that is, the forecast errors are reduced more strongly than the EDA spread values as more RO data is assimilated. This is likely related to the EDA being under-spread, an aspect that is well-established and that is actively being worked on in the context of refining our background error specification for operational NWP. The linear relationship nevertheless suggests that relative impacts appear to be adequately captured by the EDA.
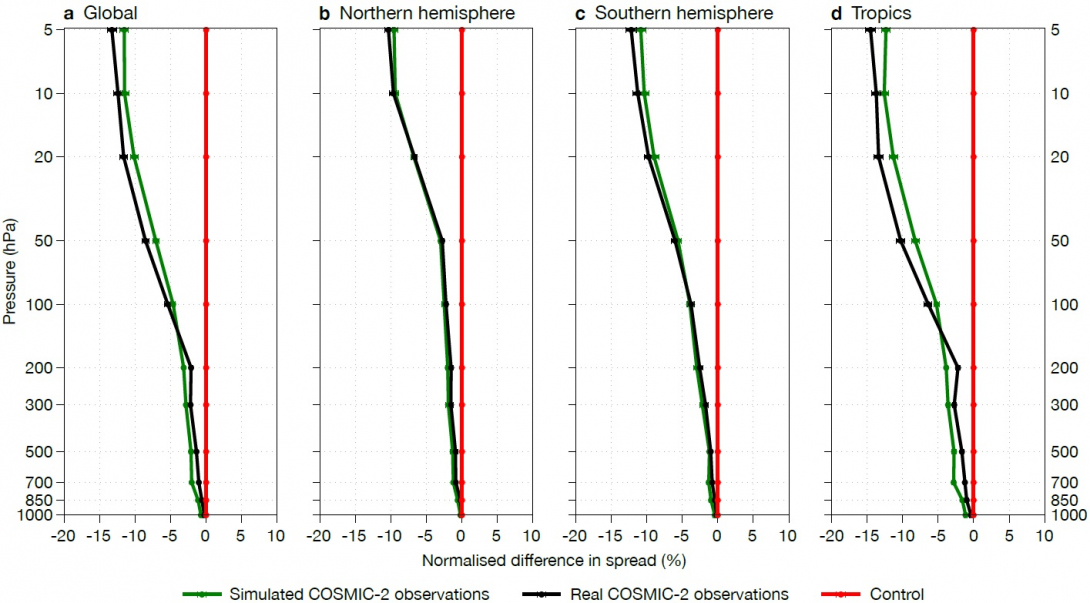
A second aspect we investigated is how EDA spread reductions obtained with real RO measurements compared to those obtained with simulated observations. As real observations we used COSMIC-2 measurements provided by the US University Corporation for Atmospheric Research (UCAR). The simulated measurements have the same times and locations as the real data, but they are simulated from ECMWF analyses in a similar way as in the Healy et al. (2013) study. The agreement in the EDA spread reduction between the real and simulated COSMIC‑2 data is quite impressive (Figure 3). The simulated data tends to result in slightly larger spread reductions in the troposphere and slightly smaller reductions in the stratosphere, particularly in the tropics. These small differences are still under investigation but appear to be related to the noise added to the simulated data. However, the key finding is that the EDA calculations with simulated COSMIC‑2 RO provide a useful estimate of the spread reductions expected with real data.
New impact predictions: MW sounding
The EDA method is now being used in an ESA-funded study to estimate the expected impact from a potential future constellation of passive MW sounders (Lean et al., 2022). Currently, MW sounders are flown on a few large satellites, such as EUMETSAT’s Metop satellites, the US National Oceanic and Atmospheric Administration (NOAA) Joint Polar Satellite System (JPSS), and China’s FY‑3 satellites, providing global coverage at selected overpass times. MW sounding from core polar orbits is part of the backbone observing system identified by the Coordination Group for Meteorological Satellites (CGMS). The motivation for complementing this backbone with further MW sounders is two-fold: 1) we continue to see significant forecast benefits from adding further existing MW sounding observations to our NWP data assimilation system, prompting the question of how much further forecast benefit could be obtained from even better temporal sampling from an optimised constellation of these instruments; and 2) developments in satellite and sensor technology make it feasible to launch MW sounding instruments on small satellites or even cube-sats, thus making constellations of these instruments a possibility. But how many more satellites would be cost-effective, in what constellation should they be flown, and what sensing capabilities should they have?
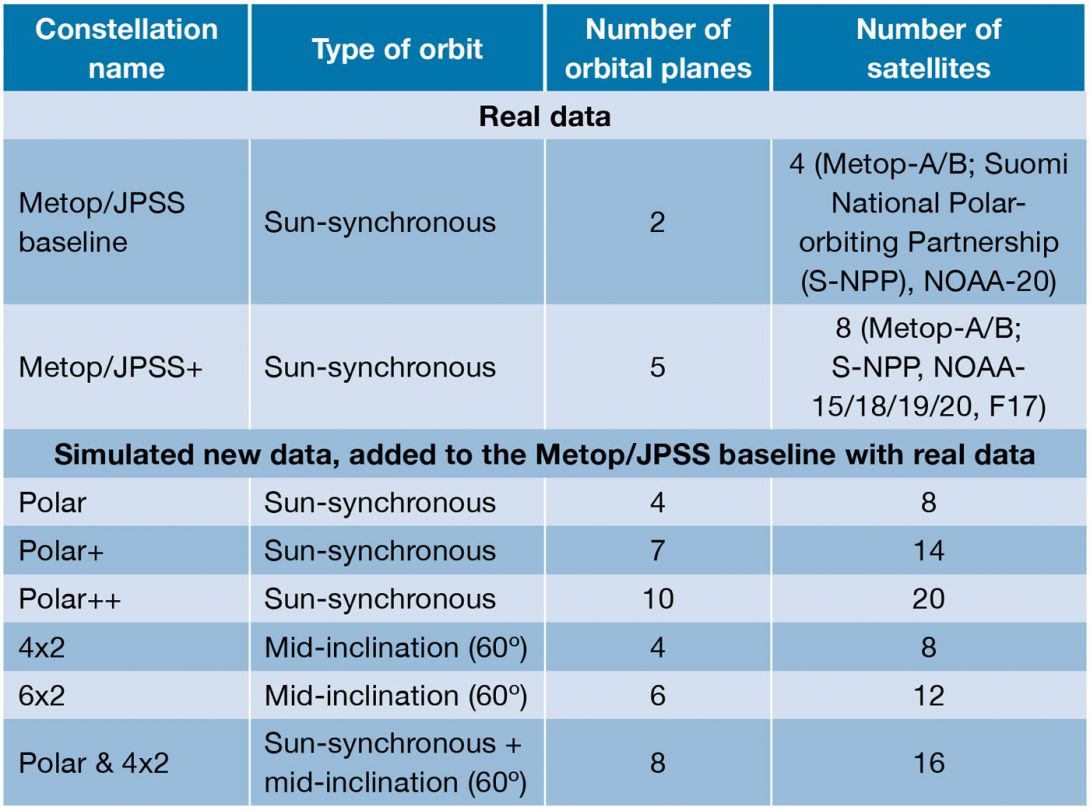
To answer these questions, we have considered a number of potential constellations, designed in collaboration with ESA and other partners (Table 1). In these constellations, we explore different numbers of satellites (ranging from 8 to 20, in 4 to 10 orbital planes) and different types of orbit (sun-synchronous polar orbits as well as mid-inclination orbits, which cover latitude bands between 75°S and 75°N only). For each of these, we also considered whether the satellite instrument only includes channels for humidity sounding (around 183 GHz, complemented by channels at 89 and 165 GHz) or additionally includes temperature-sounding capabilities (in the 50 GHz band). This is an important question as it strongly affects the design of the instrument; an instrument with humidity-sounding only can be accommodated on an even smaller and more economical satellite. For our investigations, a hypothetical MW sounding instrument was considered, consistent with being deployable on a small satellite, with characteristics broadly in line with those of the instrument considered for ESA’s Arctic Weather Satellite (www.esa.int/aws).
Results from the EDA experimentation show a clear continued benefit from adding further MW sounders. This can be seen in Figure 4, which shows the spread reduction from MW sounder assimilation as a function of the number of sounding locations assimilated. Results are shown relative to a system in which no MW sounders are assimilated, but otherwise the full observing system is used. The different data points represent spread reductions for the different constellations considered. The data point furthest to the left represents a baseline system in which real MW sounding data from two Metop and two JPSS satellites is assimilated. The next two data points depict the spread reduction resulting from adding three existing MW sounders to this baseline, either with humidity-sounding capabilities only (red) or with temperature and humidity sounding (black). The remaining data points show spread reductions from adding instead simulated data from the potential constellations considered here, again either with humidity-sounding (red) or temperature- and humidity-sounding capabilities (black). The trend of the data points from adding simulated data extends smoothly from those using only real observations, adding further confidence in the simulation results.
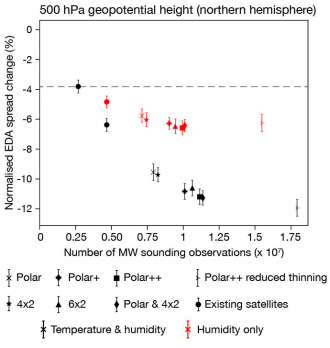
The results show that even the smallest constellations considered (‘Polar’ or ‘4x2’, i.e. eight satellites in four orbital planes) bring sizeable benefits, more than doubling the impact of MW sounders compared to the Metop/JPSS baseline. This aspect is further highlighted in Figure 5, which compares the spread reduction of the two ‘Polar’ constellations with that achieved by four existing MW sounders. From observing systems with real data, we know that the impact of these existing MW sounders translates to gains in forecast skill of several hours, suggesting that this would be a very significant improvement.
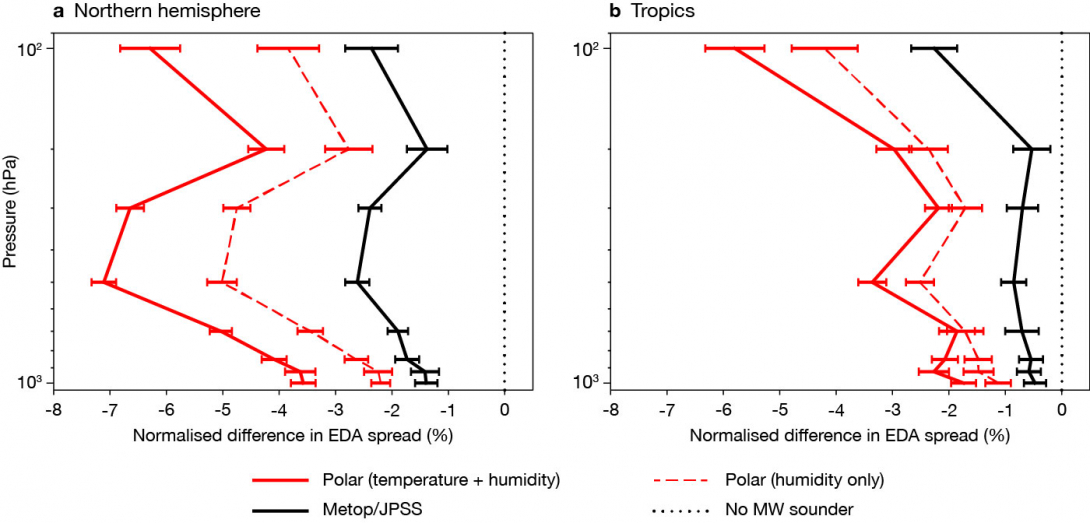
There is a very clear benefit from having the temperature sounding channels available for the additional MW sounders. While the scenarios with just humidity-sounding show significant benefit from more observations, the benefit is even larger when temperature and humidity sounding capabilities are combined (Figure 4 and Figure 5). This result was not necessarily expected, since atmospheric humidity exhibits smaller spatial and temporal scales than temperature. Higher temporal sampling could thus be expected to be even more beneficial for humidity. It is possible in this context that our findings are underestimating the benefit of the humidity-only constellations as the observation simulations may not capture the full variability, or as the spatial resolution employed in the EDA may not be sufficient to make full use of the spatial variability (model resolution: TCo399, i.e. 25 km; final incremental analysis resolution: TL255, i.e. 80 km). In the case of the added temperature channels, it appears that the reduction in the effective noise from having multiple observations plays an important role, most likely a result of the already rather small size of our typical short-range forecast errors for these channels.
Our findings also indicate a clear benefit for wind forecasts from the assimilation of MW sounding data. This is a well-established result from Observing System Experiments with real observations, and the study shows that this impact increases further when even more data are available. The wind impact is commonly attributed to the ability of 4D-Var data assimilation to infer wind information from balance relationships as well as through tracing the evolution of humidity or cloud structures during the 12‑hour assimilation window. Temperature and humidity channel sets are contributing to this wind impact in different ways, and this appears to be reflected in the geographical variations of the additional benefit that results from including the temperature-sounding channels (Figure 5): the benefit of the temperature-sounding channels for wind is largest in the extratropics and at high latitudes, enabled by geostrophic balance relationships. In contrast, the benefit of adding these channels is smaller in the tropics, probably as the humidity/cloud-tracing effect dominates. The EDA captures these different mechanisms in a physically plausible way.
One rather practical aspect encountered during the study was the role of thinning applied prior to the assimilation of MW sounding data, an aspect that becomes particularly relevant for large constellations. In line with current practice for real data, observations for the simulated data were thinned spatially, selecting only one observation within a 110 km distance per half-hour time-slot. This is to limit the effect of spatially correlated observation errors, which we can currently not account for during the assimilation. Data from all satellites of the hypothetical future constellation were thinned together, resulting in many observations being thinned out at higher latitudes, where there is most overlap in coverage. This is the reason why the increase in the number of data points shown in Figure 4 for the different constellations is not as large as might be expected, given the increase in the number of satellites. To investigate the role of thinning the constellation together, we also ran a pair of EDA sensitivity experiments in which we assimilated the largest constellation, Polar++, with the satellites spatially thinned separately rather than all together. This most extreme point in the number of observations in Figure 4 suggests that for using temperature and humidity or humidity-only channels, it is possible to approach a point where the benefit from additional measurement slows considerably. These findings highlight the sensitivity of the EDA results to practical assimilation choices and assumptions on error characteristics, an important element to keep in mind when interpreting the results.
Outlook
In partnership with EUMETSAT, we have now started applying the EDA method to two specific future satellite missions currently under consideration at EUMETSAT: the Sterna constellation of small satellites carrying MW sounding instruments, and a future Doppler wind lidar as a follow-on to the Aeolus satellite mission. These two mission concepts will be evaluated in a consistent way, over the same study period, and the comparability of the benefits and the synergies of the two missions will be a subject of the study. We also intend to collaborate with NOAA on the evaluation of their planned future MW sounding mission.
Our experience with using the EDA method has shown that it is a powerful tool to provide useful estimates of expected impact of future observations. We continue to actively investigate the performance of the EDA method and its strengths and limitations. However, as with any tools aimed at predicting future impacts, the results are subject to the assumptions made and they require careful analysis and interpretation, to make sound decisions about the future evolution of the global observing system. Importantly, any prediction of future impact can only reflect our current use of observations. For instance, the results for MW sounders shown here benefit from the all-sky assimilation of observations. By that we mean the use of satellite data in clear, cloudy and rainy conditions, a relatively recent innovation at several NWP centres. Results would probably have looked quite different 15 years ago, when MW sounding data were assimilated in clear-sky situations only. These aspects are important to bear in mind for future instrument decisions, particularly with the current drive to a more complete exploitation of all Earth system information in a coupled data assimilation framework. This development is expected to see significant changes in the amount and type of information that we extract from observations. Evaluations using the EDA method should hence be accompanied by further scientific considerations that take into account the untapped potential of future observations that is not yet accessible through our present use of observations.
Further reading
Healy, S., F. Harnisch, P. Bauer & S. English, 2013: Scaling of GNSS radio occultation impact with observation number using an ensemble of data assimilations, ECMWF Newsletter No. 135, 20–24.
Lean, K., N. Bormann, S. Healy & S. English, 2022: Final Report: Study to assess earth observation with small satellites and their prospects for future global numerical weather prediction. ESA Contract Report 4000130590/20/NL/IA, doi:10.21957/kp7z1sn1n.
Lonitz, K., C. Marquardt, N. Bowler & S. Healy, 2021: Final Technical Note of ‘Impact assessment of commercial GNSS-RO data’, ESA Contract Report 4000131086/20/NL/FF/a, doi:10.21957/wrh6voyyi.
Tan, D.G.H., E. Andersson, M. Fisher & L. Isaksen, 2007: Observing-system impact assessment using a data assimilation ensemble technique: application to the ADM–Aeolus wind profiling mission. Q. J. R. Meteorol. Soc., 133, 381–390.
