This article presents recent developments related to ocean wind waves within ECMWF’s Earth system model. A revision of how waves are generated by wind is proposed. It improves the representation of air–sea momentum exchange under strong wind conditions, such as tropical cyclones and intense windstorms. Accounting for the role of the sea state (waves) in heat and moisture exchange has also been successfully introduced. These updates are informed by the strategic view that a better representation of coupled processes at the interfaces between components of the Earth system will lead to more realistic simulations of impactful weather conditions and, potentially, to a better use of observations sensitive to the ocean surface. These developments will be part of Cycle 49r1 of ECMWF’s Integrated Forecasting System (IFS), which will replace IFS Cycle 48r1 later this year.
Revision of the wind input
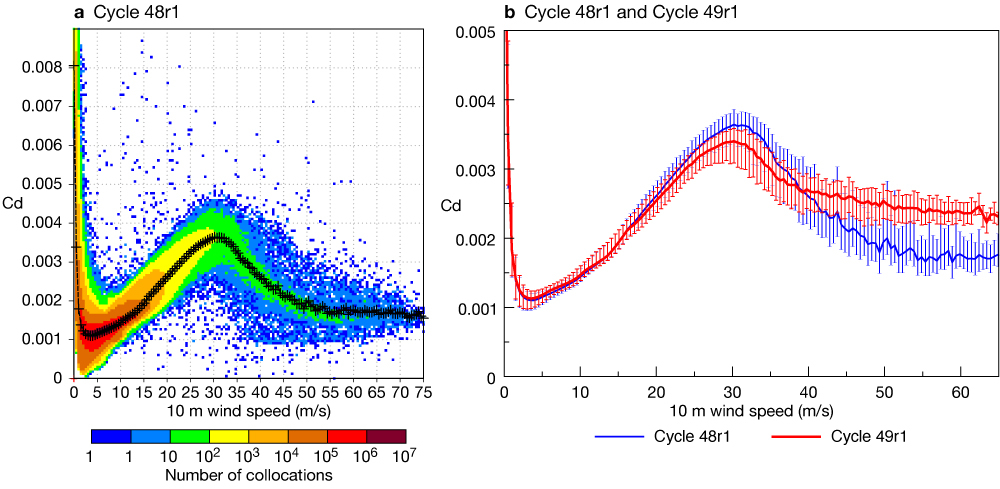
ECMWF’s Earth system model includes an ocean wind wave component (ecWAM) to represent how the generation of waves by wind modulates the exchange of momentum between the atmosphere and the ocean. In that framework, the characteristic length scale for momentum exchange is modelled by a sea-state-dependent Charnock relation, linking the surface aerodynamic roughness length to the surface stress. Because more momentum is always extracted from the wind when waves are growing, the drag coefficient (Cd) over the ocean tends to increase with wind speed, in line with the finding from observation campaigns (Edson et al., 2013).
However, recent experimental evidence suggested that Cd should generally reach maximum values for storm winds but should level or even decrease for particularly strong winds, such as in tropical cyclones or intense mid-latitude windstorms. The exact physical processes responsible are still a matter of active research. There is a decoupling between near-surface winds and the surface for strong wind situations. This could be due to flow separation, spray generation and wave dissipative effects, which are absent at lower wind conditions, and the impact of heavy rainfall, to name but a few factors, all of which reduce the transfer of momentum into the wave fields.
Based on this evidence, we aimed to adapt model parametrizations to reduce the drag coefficient for high winds. The latest revision was implemented in IFS Cycle 47r1, which became operational in 2020. The transfer of momentum from wind to waves was modified at the time by imposing an ad hoc sharp reduction of the parametrized contribution of the short gravity-capillary waves to the overall momentum flux. Note that those short gravity-capillary waves, with a wavelength of the order of centimetres, are not explicitly represented in the model, and their impact is therefore parametrized. Because the intention of that change was to tackle the intensity error in tropical cyclone conditions, it was only applied to 10 m winds above 33 m/s. The idea was that a strong decoupling between winds and short waves is happening in those conditions. The new model was found to yield a better maximum wind/minimum pressure relation, in particular at a high resolution (Bidlot et al., 2020; Majumdar et al., 2023).
Since the introduction of this simple reduction, we have worked on a more physically based model that would not require a fixed wind threshold. Based on the theoretical work of Janssen and Bidlot (2023), the current wind input parametrization can be extended to include a simplified model for the impact of short gravity-capillary waves on the surface stress, and for nonlinear feedback from the waves on further growth by wind. The new model tells us that, under strong wind conditions, the short gravity-capillary waves are less able to absorb momentum from the wind as hypothesised with the simple reduction scheme. But this is the case for storm conditions (wind > 20 m/s), well before the hardcoded threshold of 33 m/s of the simple reduction scheme. At the same time, as the sea state grows and larger and longer waves appear, a nonlinear feedback kicks in, reducing the growth rate of the waves. Essentially, further growth, and hence further transfer of momentum into the ocean, is stalled. For low wind conditions (< 10 m/s), the new parametrization behaves generally like the previous one. Only for a sea state approaching an equilibrium between wind input and dissipation (fully developed sea) as is quite common in the trade winds, the interaction with the wind becomes weaker, resulting in a slightly lower contribution from the local wind to the overall significant wave height. Note that, since waves propagate away from the generation areas into the rest of the ocean basin as swell, it was necessary to adjust slightly how swell is attenuated as it propagates over a large ocean expanse. This is to avoid flooding the tropics with excessive swell energy.
Figure 1a shows the distribution of Cd in IFS Cycle 48r1 plotted against 10 m wind speed for Category 5 Hurricane Lee in the North Atlantic in September 2023. This simulation was performed at the experimental TCo2559 resolution (4.4 km) because at that resolution the IFS is better able to intensify tropical cyclones and to yield very strong winds (Majumdar et al., 2023). A comparison with the new parametrization of IFS Cycle 49r1 is shown in Figure 1b. Here, for clarity the full distribution has been replaced by the binned mean values and error bars for one standard deviation on either side of the mean. The impact of the new model is visible for winds of about 20 m/s with a reduction of Cd with respect to the old system. Both versions produce the expected sharp decrease for wind above 30 m/s. The new parametrization, however, has a lesser decrease for winds above 40 m/s, in line with recent observations of Curic and Haus (2020). Note that tropical cyclones are controlled by momentum loss (drag) but also heat and moisture fluxes. The impact of waves on the latter is revisited in the next section.
Sea-state-dependent heat and moisture fluxes
Recent experimental evidence points to a sea state/wind dependency on the sensible and latent heat flux.
To capture this, the theory behind the wind input as described above can be extended to include thermal stratification (Janssen & Bidlot, 2018). It can then be shown that wave-induced motions in the air lead to an enhancement of the heat and moisture exchange between the ocean and the atmosphere. Otherwise, this exchange would be controlled only by molecular transfer at the sea surface and turbulence. The theory yields a sea-state-dependent parameterisation for the roughness length scales for heat and humidity. Note that the effects of spray as generated by whitecaps and breaking waves are still ignored.
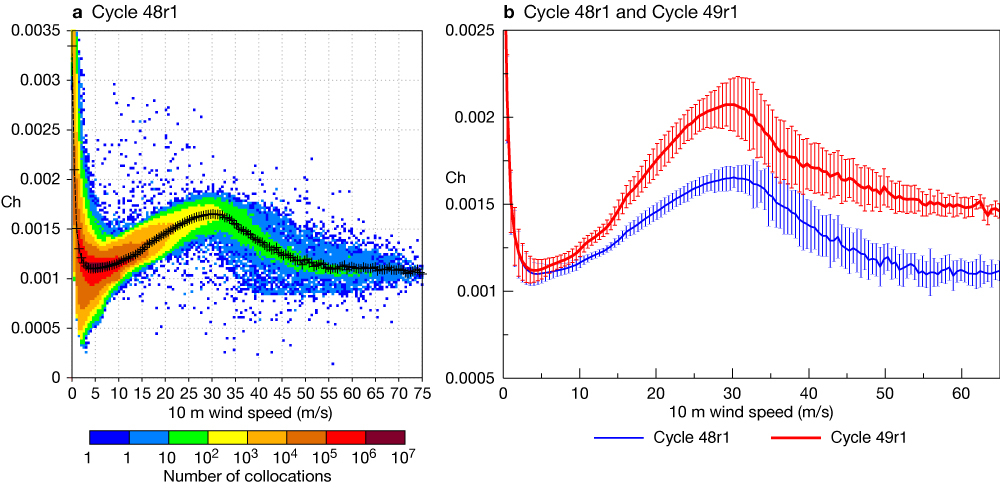
Figure 2 shows a similar plot to Figure 1, but for the heat exchange coefficient (Ch) instead. Note that from scaling arguments, and based on the actual parametrization at ECMWF, Ch has always been proportional to the square root of Cd. This explains the similar mean dependency of both exchange coefficients on wind speed. However, in Cycle 49r1, with the added sea-state dependency, the heat exchange will tend to be increased with respect to previous cycles, for storm wind conditions. As mentioned above, the new model will have slightly higher drag for intense tropical cyclones, in line with recent observations, potentially slowing cyclone intensification. But at the same time, the heat and moisture exchanges will be enhanced, favouring storm intensification. It was found that the impact of combining both changes was fairly neutral on the scores for tropical cyclone track and intensity (Magnusson et al., 2021).
Other changes
In nature, waves and sea ice interact. These interactions are most prominent in the Marginal Ice Zone (MIZ). Waves can contribute to sea ice break-up and to mixing of warmer ocean water with the surface, leading to the continued existence of the MIZ. At the same time, sea ice attenuates and dissipates wave energy. This is an active current topic of research. However, these interactions are inexistent in the current operational system. Instead, sea ice is treated as if it were land. More precisely, when sea ice cover is above 30%, all wave spectral components are fully absorbed (i.e. set to 0), while for a lower sea ice threshold, sea ice has no impact on waves. For global wave forecasting, this was a fair assumption to make. However, the wave model is now part of ECMWF’s Earth system model. It needs to supply relevant information to the other components (atmosphere and ocean). As a first step, over sea ice a new set of empirically derived default values for the relevant parameters has been introduced for Cycle 49r1 that were found to perform better than the previous set.
In addition, from Cycle 49r1 onwards, assimilation of altimeter wave height data will be done in hourly sequential windows rather than 6‑hourly ones. This change has already been implemented in ERA5. It ensures a better use of the data as they are assimilated nearer to the time when the observations were made. It has a positive impact on short-range wave forecasts, but very little impact on other Earth system model components. Note that, since the wave data assimilation is still based on a simple sequential optimum interpolation scheme, the verifying analyses used in the forecast scores calculation will have seen less observations than before.
Resolution upgrade
The wave model is currently using a reduced latitude–longitude grid with a horizontal grid spacing about 1.5 coarser than that of the atmospheric model (0.125° or 14 km for waves and 9 km for the atmosphere). With Cycle 49r1, the wave model will be run on the same grid as the atmospheric model, simplifying the data exchange between the two systems. With higher resolution, the wave model is better able to capture the atmospheric forcing, and details of the coastal conditions are generally better represented. Note, however, that wave conditions in coastal areas will still be determined to a large extent by the quality of the forcing, the resolution of which has not changed. At 9 km, many small islands and bathymetric features are not resolved. It is still necessary to use the empirical parametrization that accounts for the impact of those small-scale features on the wave propagation. A small adjustment to the scheme was made for the new grid.
A few technical changes were necessary to reduce the cost of a higher horizontal resolution for the waves. The numerical scheme for the wave propagation has a strict constraint on the maximum time step that can be used. Finer resolution would imply a smaller time step. However, the scheme was modified to be split between long waves, which propagate the fastest and use the same time step as before, and shorter waves, which propagate more slowly and can use a larger time step. We use 36 frequency bins to discretise the wave spectrum, representing waves between 1,300 m and 1.5 m. The threshold between fast and slow waves is determined by the atmospheric model time step. For typical values for the atmospheric time step at TCo1279 (ECMWF’s triangular–cubic–octahedral grid with a grid spacing of 9 km), long waves are those with a wavelength longer than about 600 m, represented in the first five frequency bins. Only a small fraction of the wave spectrum then requires a smaller time step, the rest of the spectrum can be advected with a longer time, greatly reducing the overall run time.
In Cycle 48r1, the atmosphere and the waves exchange information every atmospheric time step (450 s at TCo1279). However, as the atmospheric resolution is increased and its respective time step is reduced, we found that it is no longer necessary to couple the two system so tightly. At TCo1279, coupling every two atmospheric time steps and integrating the wave physics over that longer interval was found to be sufficient, significantly reducing the running cost in Cycle 49r1.
At TCo1279, the wave spectrum is discretised with 36 frequencies and 36 directions. However, to reduce the data volume, please note that in Cycle 49r1 only the first 29 frequencies will be output spanning a range from ~0.035 Hz to ~0.5 Hz. Higher frequencies tend to be in balance with the wind forcing. Therefore, even when used to restart the model, the high-frequency part of the spectrum is re-established within one time step without the need to have that information loaded from the initial conditions. Moreover, most wave spectral observations have a cut-off frequency around 0.5 Hz or lower.
Impact
The performance of the new model was first tested in standalone mode, where ecWAM was run at operational resolution with prescribed 6-hourly atmospheric forcing from the operational analysis from August 2022 to August 2023. Altimeter wave heights from Jason‑3, Cryosat‑2, Saral, and Sentinels 3A, 3B and 6A were assimilated. Significant wave heights predicted by the model can be compared to altimeter data and independent in‑situ observations not used by the wave data assimilation. The in‑situ observations are those used by the Lead Centre for Wave Forecast Validation (Haiden et al., 2019). Table 1 shows the performance gain in terms of scatter index with respect to Cycle 48r1, first using the same grid for waves as Cycle 48r1 (0.125° or 14 km, reduced latitude–longitude), and then with the new TCo1279 grid option. Note that these simulations only assess the impact of the change in the wind input and the change in resolution. Overall, both changes have a cumulative beneficial impact. The impact of the resolution change is most pronounced when a comparison is made to in‑situ observations. These observation sites are mostly located in the northern hemisphere in near-coastal environments, where increased resolution can result in further improvement.

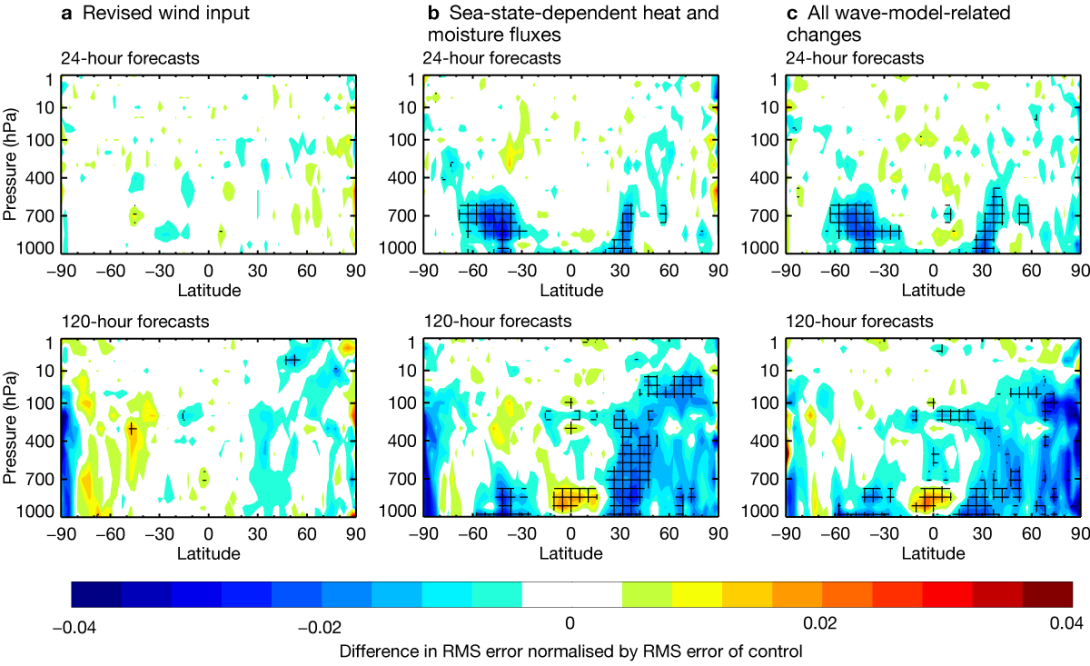
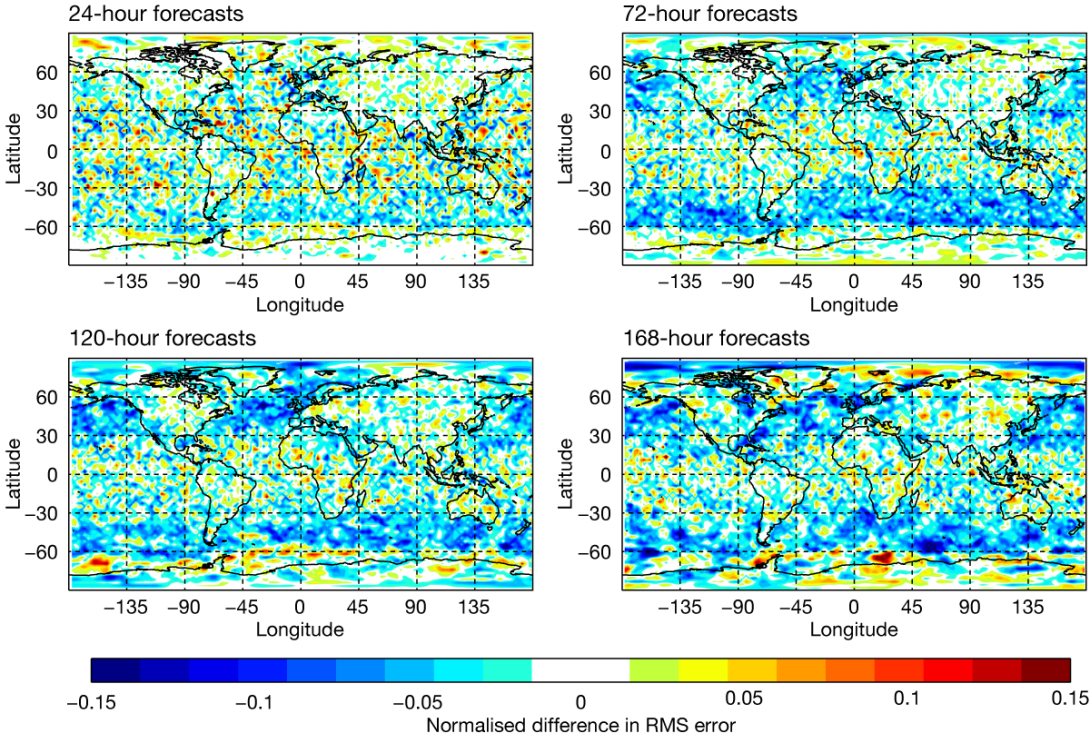
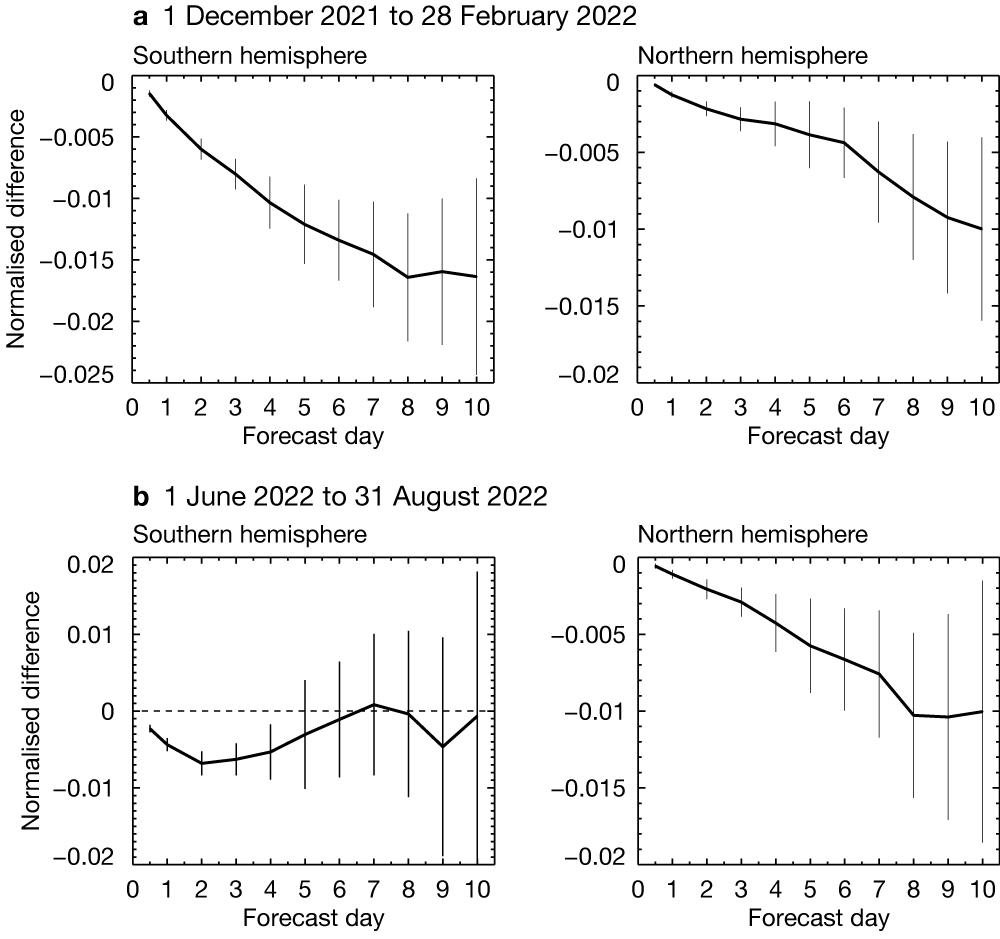
The changes have also been tested in coupled mode. A series of analysis experiments at TCo399 were performed covering one northern winter season (2021–2022) and one northern summer season (2022). Looking first at the broad atmospheric response, Figure 3a shows that the change to the wind input parametrization in ecWAM and the change in wave resolution alone had a neutral impact on atmospheric temperature scores. The same can be said about the impact on other variables. On the other hand, the sea state effect on heat and moisture exchanges is widely beneficial (Figure 3b,c). It results from a clear warming in the lower troposphere over the oceans in the tropics and the winter hemisphere (not shown). Near-surface temperatures are improved (Figure 4). Root-mean-square error scores for tropical temperature at around 850 hPa are slightly degraded as the model already exhibits a positive bias at those levels. This bias aspect will be partially addressed by other contributions to Cycle 49r1 (not shown) and will continue to be analysed in future model developments.
From the point of view of modelling the strong interactions between wind and waves, this set of changes will tend to reduce the dampening effect waves have on near-surface winds through weaker feedback on the momentum flux, and it will enhance the heat and moisture uptake over the oceans. As a result, more intense depressions with stronger winds during mid-latitude storms are produced. These stronger winds ultimately generate higher waves in the storm tracks. Figure 5 shows that, with the new formulation, significant wave heights tend to be higher in the storm track of the southern hemisphere for all seasons and in the northern hemisphere winter. Recall also that, for fully developed sea in trade wind conditions, the new model produces a lower contribution to the overall significant wave height. Hence, significant wave height in tropical areas is lower except if directly affected by strong swell emanating from the Southern Ocean, such as in the Indian Ocean during austral winter (Figure 5b).

Forecast scores for wave parameters against own analysis were found to be slightly degraded with the new wind input changes alone (Figure 6a) due to enhanced variability. However, against in‑situ observations there is a small improvement like the one described in Table 1. Adding the sea state dependency on heat and moisture fluxes had a small beneficial impact on forecasts of waves via its positive effect on the atmospheric scores (not shown). The combination of all changes gives an apparent big gain in performance for short lead times when verified against own analysis (Figure 6b). This is partly an artefact of the verifying analysis having seen less observations at the time it is compared to forecasts than in the reference experiment. Nevertheless, compared to observations, the impact is less but still positive.

So far, we have focussed on significant wave height as it is the only wave parameter that is reliably observed globally by altimeters which currently enter the wave data assimilation. Scores for mean wave periods are also indicative of the impact of the changes we make; however, the analysis is not constrained by any observations. Change in the mean state can potentially appear has having a large impact. The new system does indeed yield larger mean wave periods in the tropics linked to long swell contributing a bit more to the overall sea state than before. Consequently, scores appeared degraded. The new model is expected to produce more swell, and some retuning of the swell attenuation formulation was done. The present choice might still be sub-optimal. Future work should diagnose the model performance in tropical areas where in-situ observations are in short supply with wave spectra derived from Synthetic Aperture Radar (SAR) and recently available drifting buoys to steer new developments.
Finally, changing how wave parameters are estimated when sea ice cover is above 30% has a small positive impact on the sea ice cover forecasts (Figure 7). Ideally, the wave model should be run when sea ice cover is above this threshold. Recent progress has been made by the community on how to best represent wave–sea-ice interactions. Work is ongoing on implementing some of those findings in future model cycles.
Conclusion
The evolution of ocean wind waves determines ocean surface stress. A revision of how this momentum exchange is modelled in ECMWF’s Earth system model is part of the upcoming Cycle 49r1. It is intended to be more consistent with recent estimates of drag coefficients under storm wind conditions (> 20 m/s). Moreover, the direct impact of waves on surface heat and moisture transfers was introduced in the atmospheric model. Cycle 49r1 will also see an increase in horizontal resolution for the wave products as the wave model will be running on the same grid as the atmospheric model component (i.e. TCo1279, which means 9 km for medium-range products, down from 14 km before). This will increase the consistency between waves and atmospheric parameters and provide added resolution in coastal environments.
Peak surface winds and significant wave heights during intense windstorms should generally be better represented with Cycle 49r1. Low-level temperatures over the ocean will also be slightly higher in the tropics and the winter hemisphere.
The current model does not explicitly account for the role of sea spray and active wave breaking in the calculation of ocean surface fluxes. These conditions tend to occur under extreme wind situations. Future work should investigate whether introducing such processes can be beneficial, as ECMWF aims to run forecasts at kilometre scale, where the modelling of such extremes will be possible.
The small change in how wave parameters are passed to other components of the Earth system in sea-ice conditions hints at the possible importance of wave–sea-ice interactions. Work has started on adding these interactions, with potential for future progress.
Further reading
Bidlot, J.-R., F. Prates, R. Ribas, A. Mueller-Quintino, M. Crepulja & F. Vitart, 2020: Enhancing tropical cyclone wind forecasts, ECMWF Newsletter No. 164, 33–37.
Curcic, M. & B.K. Haus, 2020: Revised estimates of ocean surface drag in strong winds. Geophys. Res. Lett., 47. https://doi.org/10.1029/2020GL087647
Edson, J.B., V. Jampana, R.A. Weller, S.P. Bigorre, A.J. Pluedemann, C.W. Fairall et al., 2013. On the exchange of Momentum over the Open Ocean, J. Phys. Oceanogr., 43, 1378–1391.
Haiden, T., Z. Ben Bouallègue, R. Mládek & J.-R. Bidlot, 2019: WMO Lead Centre for Wave Forecast Verification established at ECMWF, ECMWF Newsletter No. 161, 13–14.
Janssen, P.A.E.M & J.-R. Bidlot, 2018: Progress in Operational Wave Forecasting, Procedia IUTAM, 26, 14-29. IUTAM Symposium on Wind Waves, 4–8 September 2017, London, UK.
Janssen, P.A.E.M & J.-R. Bidlot, 2023. Wind–Wave Interaction for Strong Winds. J. Phys. Oceanogr., 53.
Magnusson, L., S. Majumdar, R. Emerton, D. Richardson, M. Alonso-Balmaseda, C. Baugh et al., 2021: Tropical cyclone activities at ECMWF. ECMWF Technical Memorandum No. 888.
Majumdar, S.J., L. Magnusson, P. Bechtold, J.-R. Bidlot & J.D. Doyle, 2023: Advanced Tropical Cyclone Prediction Using the Experimental Global ECMWF and Operational Regional COAMPS-TC Systems. Mon. Wea. Rev., 151, 2029–2048.
