
Philippe Lopez, Physical Processes Team and Inna Polichtchouk, Numerical Methods Team, both in the Earth System Modelling Section
It’s odd how scientific research works out sometimes – that you can discover something quite unexpected while investigating something else.
The US INCITE programme has provided the unprecedented opportunity to run ECMWF’s Integrated Forecasting System (IFS) at a resolution of 1.4 km on Summit, the US Department of Energy’s exascale machine and one of the most powerful computers in the world. These experiments are one component of ECMWF’s work to develop kilometre-scale operational forecasts – a goal which represents a huge research challenge in Earth system modelling, data assimilation and computational science.
Our work within the INCITE programme has focused on assessing how atmospheric physical and dynamical processes and their interaction with the surface are currently simulated by the IFS at near kilometre scale, with a particular interest in tropical cyclones.
A very strange cloud-clearing phenomenon
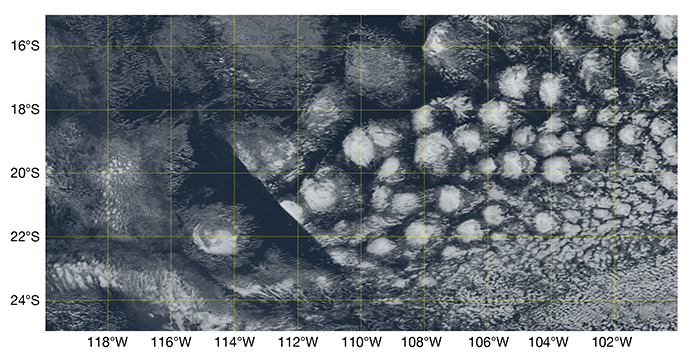
During the scientific evaluation of one of those forecasts, we came upon a rather odd looking feature in the simulated natural colour (visible spectrum) image (Figure 1). In this zoom over the tropical South Pacific, valid on 6 September 2017 at 1800 UTC (42 hours into the forecast), a large cloud-free hole appeared right in the middle of the low-level trade wind cloud deck, with a strikingly sharp edge on its eastern flank. It just looked as if the modelled clouds had simply been erased from the image over several hundreds of kilometres.
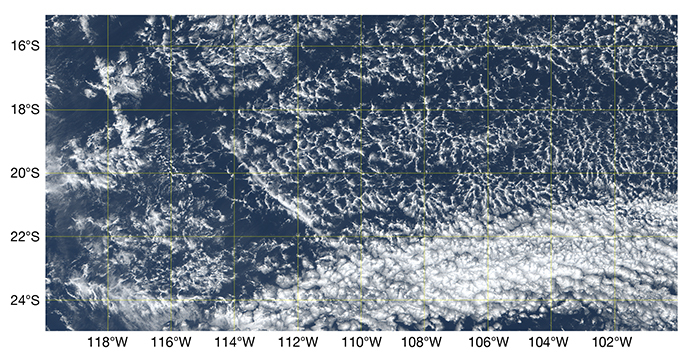
At first, we thought that this very unusual pattern could be the result of some error in our processing or plotting of the image. However, no such errors could be identified. This investigation took an even more surprising turn when the corresponding image from the GOES-16 geostationary satellite revealed a rather similar collocated pattern (Figure 2). As a side note, these two figures also illustrate the well-known tendency of the IFS to produce too large low-level trade wind cumulus clouds over oceans, compared to observations (closed-cell versus open-cell convection; see Lopez et al. 2022).

Figure 1: Natural colour image simulated from the INCITE 1.4 km resolution 42 h global IFS forecast valid at 1800 UTC on 6 September 2017, in the tropical South Pacific. The strange sharp-edged hole in the simulated low-level clouds can be seen between longitudes 115°W and 111°W.

Figure 2: Corresponding natural colour image based on observations from the GOES-16 geostationary satellite at 1 km resolution, valid at 1800 UTC on 6 September 2017, in the tropical South Pacific. An area of sharp transition from almost cloud-free to cloudier conditions can be identified between longitudes 115°W and 111°W, which is consistent with the IFS simulation shown in Figure 1. Credit: NOAA Comprehensive Large-Array data Stewardship System (CLASS).
We then decided to further investigate the origin and nature of this rather unusual cloud pattern found in both model and observations by looking at the following two animations. The first animation shows the evolution of cloud water amounts from the IFS over a 30-hour period, while the second displays visible-spectrum reflectances as measured by the GOES-16 satellite over a 10-hour period.
Figure 3: 30-hour animation (every 10 min) of total column cloud water amounts simulated by the IFS at 1.4 km resolution between 1800 UTC on 5 September and 0000 UTC on 7 September 2017, in the tropical South Pacific. The cloud-clearing effect of the eastward-propagating atmospheric solitary wave is particularly conspicuous between longitudes 115°W and 111°W, towards the end of the animation.
Figure 4: 10-hour animation of visible spectrum reflectances (0.64 micron wavelength; every 15 min; 500 m resolution) observed by the GOES-16 geostationary satellite between 1400 UTC on 6 September and 0000 UTC on 7 September 2017, in the tropical South Pacific. Yellow and red colours highlight the thickest sunlit clouds, while blue colours indicate cloud-free or night-time regions. The cloud-clearing effect of the eastward-propagating atmospheric solitary wave is particularly clear between longitudes 115°W and 111°W. Credit: NOAA Comprehensive Large-Array data Stewardship System (CLASS).
In both animations, we can identify a particularly well-defined atmospheric solitary wave which propagates eastwards at around 10 m/s. It is responsible for the spectacular temporary dissipation of clouds in both model and observations on 6 September 2017 after 1800 UTC, between longitudes 115°W and 111°W. In the present case, we found that this wave originated from the region of sustained convective activity located at around 22°S and 126°W, with a likely additional contribution from the upper-troposphere jet stream.
Furthermore, the careful examination of both animations reveals that similar large-scale, cloud-clearing atmospheric waves are active in other parts of the displayed domain. While the effect of atmospheric gravity waves on low-level clouds has already been documented in the literature (see Allen et al. 2013; Yuter et al. 2018), the sheer extent of the phenomenon in our case (both in model and observations) is astonishing.
Cloud-clearing wave mechanisms
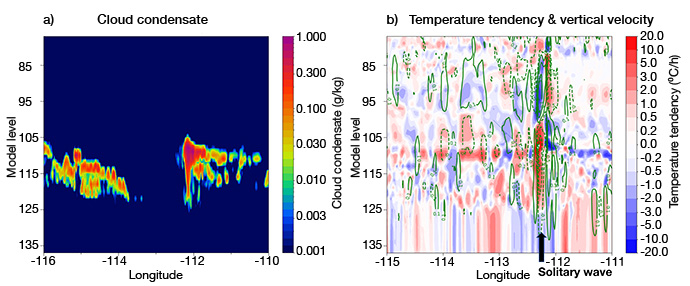
Finally, to explain the wave’s cloud-clearing mechanism, we present vertical cross-sections of cloud condensate content, vertical velocity and temperature tendency forecast by the IFS, along latitude 21.3°S (Figure 5). One should note that only model data allow us to study the detailed three-dimensional structure of the waves and its temporal evolution, something which is not yet possible with current observations.
The temporary disappearance of the cloud deck at the centre of Figure 5a is caused by the pronounced downward motion (negative isolines in Figure 5b) around model level 110 (2200 m altitude), at the rear of the solitary wave. This downward motion results in a local warming (dark red shading in Figure 5b), which explains the sudden, total evaporation of cloud condensate. Once the wave has passed, normal conditions return, and the clouds gradually reappear (west of 114°W, in Figure 5a).

Figure 5a: Vertical cross-section of cloud condensate content from the IFS along latitude 21.3°S, valid at 1800 UTC on 6 September 2017 (42-hour forecast). The hole in the cloud deck caused by the eastward-propagating atmospheric solitary wave is obvious at the centre of the domain. Vertical levels range from the surface (bottom) to near the tropopause (top).
Figure 5b: As for Figure 5a, but for vertical velocity (negative values (downward motion) shown as dashed green isolines; positive values (upward motion) shown as solid green isolines) and temperature tendency over the last model time-step (cooling in blue, warming in red shading). The location of the eastward-propagating atmospheric solitary wave is shown by the arrow.
Implications of our findings
In conclusion, we find it remarkable that the IFS can simulate long-lived atmospheric solitary gravity waves that are frequently triggered by remote thunderstorms. Such ability is expected to contribute to the overall forecast quality.
While such gravity waves and their interaction with clouds have been known for some time, their cloud-clearing action on such a massive scale has never been documented. This is because their most obvious impact is on low-level cloud decks over oceans and can therefore only be observed using animations of visible-spectrum images from geostationary satellites, something that meteorologists do not do on a routine basis.
It is also worth underlining that large-scale cloud-clearing waves can be identified not only in kilometre-scale IFS predictions, but also in operational forecasts at 9 km resolution, which highlights the consistency of IFS forecasts across resolutions.
Future work should aim at checking how predictable these atmospheric gravity waves can be and how they might interact with more severe weather events, such as tropical cyclones.
References
Allen, G., Vaughan G., Toniazzo, T., Coe, H., Connolly, P., Yuter, S. E., Burleyson, C. D., Minnis, P., and Ayers, J. K., 2013: Gravity-wave-induced perturbations in marine stratocumulus, Quart. J. Roy. Meteorol. Soc., 139: 32-45, https://doi.org/10.1002/qj.1952.
Lopez, P., Matricardi, M., and Fielding, M., 2022: Validation of IFS+RTTOV/MFASIS solar reflectances against GOES-16 ABI observations, ECMWF Technical Memorandum 892, 27 pages.
Yuter, S. E., Hader J. D., Miller M. A., Mechem D. B., 2018: Abrupt cloud clearing of marine stratocumulus in the subtropical southeast Atlantic, Science, 361, 697-701, https://doi.org/10.1126/science.aar5836.
