
ecCharts is a suite of web-based applications to inspect, explore and visualise ECMWF forecast data in an interactive way. It now offers nearly 300 layers representing surface and upper-air parameters from ensemble (ENS), high-resolution (HRES), extended-range (ENS Extended) and wave forecasts. Content and functionalities are updated regularly based on requests from users. The latest and previous updates can be accessed on ECMWF wiki pages: https://confluence.ecmwf.int/display/ECCHARTS/Updates.
Among many new additions, the November 2020 update includes medium-range deviations/anomalies, extended-range Cumulative Distribution Function (CDF) diagrams, new vertical wind shear options, and powerful tools to share ecCharts content between users.
Deviations/anomalies
The ‘Deviation/Anomaly’ layers provide a spatial representation of the deviation of 24‑hour forecast fields from model climate (M-Climate) metrics, at all available lead times. Four parameters are available: 2‑metre temperature and 10‑metre wind speed (both being 24‑hour means, computed from four values at 6-hour intervals ending at the selected time) and also total precipitation and total snowfall (both being 24‑hour accumulations ending at the selected time).
The layers display the absolute difference, for a user-selected parameter and model run, between forecast values and a user-selected M-Climate percentile. The model run options are: ENS control, ENS mean and HRES, whilst the M-Climate percentile options are: 1, 10, 25, 50, 75, 90 and 99%. The M-Climate distributions used are pre-computed from re-forecast data, partitioned into 24‑hour periods in much the same way as the forecast values are. These M‑Climate distributions are also used for other products, such as the EFI (Extreme Forecast Index).
Users can see absolute values of the configured deviation for a site by clicking on the map, or by searching for a city/place.

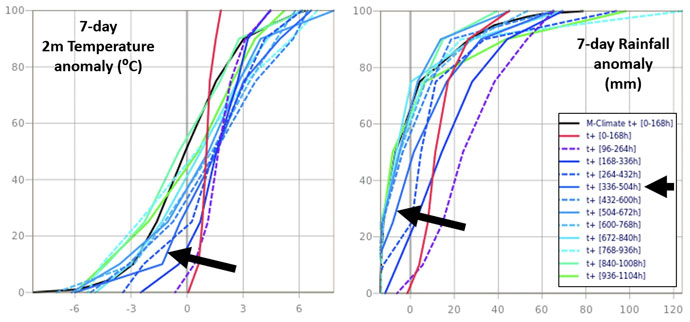
Extended-range CDFs
To complement the EFI and Shift of Tails (SOT) in the extended range, which was introduced for two parameters with Cycle 46r1 of the Integrated Forecasting System in June 2019, a facility to view extended-range CDFs was also introduced into ecCharts in 2020. Unlike ECMWF’s pre-existing CDF-viewing tools, which are used for 24‑hour periods at shorter ranges and show absolute values, these CDFs depict anomalies (relative to extended-range M-Climate means). They cover the following parameters:
- 2-metre weekly mean temperature
- 7-day total precipitation
Extended-range CDF diagrams are available for all extended-range grid points and for all extended-range time steps. They display all previous and current forecasts validating on the base chart’s valid time, which denotes the end of the 7-day period in question. They are available via the menu item ‘View > Meteogram window’ in the ecCharts interface. They are also accessible from the Dashboard interface menu by choosing ‘Add widget > New EFI/CDF meteogram widget’.
A comprehensive description of extended-range CDFs, together with the extended-range EFI/SOT products, can be found in ECMWF’s Forecast User Guide: https://confluence.ecmwf.int/display/FUG/Extended+Range+-+CDFs%2C+EFI+and+SOT.
Vertical wind shear
Meanwhile, the 10‑metre level has been added as a new level option within the ‘vertical wind shear’ layer. Whilst previously this could only be plotted as a scalar field (i.e. magnitude), a separate vector layer is now also available, to denote the full wind shear (its magnitude and direction) between 10 metres and 500 hPa (called ‘0–6 km shear’). These new fields can be combined with CAPE as shown in the third figure, to provide an easy tool to diagnose where CAPE and large deep-layer shear (say over 20 m/s) may favour organised deep, moist convection. The example shows that large CAPE and 0–6 km shear overlap over the eastern Mediterranean in front of the approaching upper trough.
ecCharts sharing
ecCharts sharing functionality has been available to users since the beginning of 2020 as an experimental feature. With this latest update, tools have been improved by taking into account user feedback. The revised tools allow a user to send a product, a projection, a Dashboard widget (a single chart or a meteogram in Dashboard) or a Dashboard tab to other ecCharts users. Once exported and activated by the receiving user, that user will have their own copy. Indeed, an item can be shared with one or many ecCharts users. This is an extremely powerful tool to use in organisations where different users – e.g. shift forecasters – want to all plot data in the same way; it prevents them from all having to go through the same configuration process. Documentation on how to use the sharing feature is available here, under ‘Sharing in ecCharts and Dashboard’: https://confluence.ecmwf.int/display/ECCHARTS/ecCharts+updates+-+November+2019.
