At the beginning of October 2020, storm Alex affected large parts of western Europe, bringing wind gusts above 50 m/s to northwest France and precipitation locally more than 500 mm/24 hours to northern Italy and southeast France that resulted in multiple fatalities. As Alex’s centre decayed over France on 3 October, new cyclonic developments on the northern flank brought the wettest day on record for the UK.
Storm Alex developed from a warm front wave moving east-southeast across the North Atlantic into the circulation of a large-scale upper trough. The surface cyclone rapidly intensified south of Ireland on 1 October below the ‘left-exit’ of a jet stream. Subsequently, a sting jet feature seems to have formed just south of the cyclone centre, hitting the coast of Brittany in France around 00 UTC on 2 October with extreme wind gusts (see top right chart). While the main cyclone centre stayed near Brittany over the next 24 hours, its cold front progressed toward the southeast and caused local flooding and strong wind gusts in southwest France and Spain. Ahead of the front, strong water vapour flux in the form of an atmospheric river was situated across the Mediterranean Sea from the Straits of Gibraltar to southeast France and northwest Italy; this led to torrential rainfall a little way inland from the French/Italian coast and over the southern Alps, primarily overnight from 2 to 3 October. In this article we will discuss the prediction of both the wind gusts over Brittany and the rainfall over southern France and northern Italy.
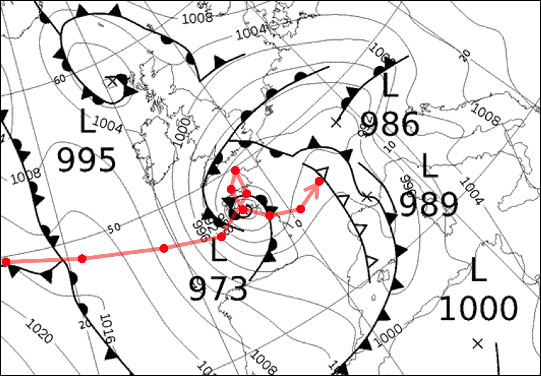
%3Cstrong%3ESurface%20analysis.%3C/strong%3E%20This%20is%20the%20UK%20Met%20Office%20surface%20analysis%20for%2018%20UTC%20on%202%20October%202020.%20Alex%20is%20the%20973%20hPa%20cyclone.%20The%20red%20line%20shows%20the%20complete%20track%20of%20Alex%20as%20inferred%20from%20these%20charts.%20It%20starts%20at%2000%20UTC%20on%201%20October%20and%20ends%20at%2012%20UTC%20on%203%20October,%20with%20dots%20at%206-hour%20intervals.Surface analysis. This is the UK Met Office surface analysis for 18 UTC on 2 October 2020. Alex is the 973 hPa cyclone. The red line shows the complete track of Alex as inferred from these charts. It starts at 00 UTC on 1 October and ends at 12 UTC on 3 October, with dots at 6-hour intervals.
Wind gust predictions
Starting with the wind over Brittany, the most severe band of gusts was associated with the tip of the backbent front, and as such had some of the hallmarks of a sting jet. The cloud structure associated with the feature was visible in satellite images and was also present in ECMWF’s short-range high-resolution (HRES) forecast. The maximum wind gusts in forecasts 3 days before (29 September 12 UTC) and onwards ranged from 44–51 m/s, compared to 51 m/s in observations. Such predictions give confidence that the model can simulate this type of fine-scale feature. Going further back to forecasts from earlier dates, one sees the forecast signal sharply decrease. In those earlier forecasts, strong wind gusts were predicted, but not at the observed levels. Indeed, those gust forecasts had more broadscale characteristics, more reminiscent of a cold jet phenomenon, and linked to a larger cyclonic circulation over the Bay of Biscay which lacked the intense gradients found near the core of Alex (see the Extreme Forecast Index in the left-hand panel below).
%3Cstrong%3EExtreme%20Forecast%20Index.%3C/strong%3E%20Extreme%20Forecast%20Index%20(EFI)%20for%2024-hour%20maximum%20wind%20gusts%20on%201%20October%20(left)%20and%20precipitation%20from%2000%20UTC%20on%202%20October%20to%2000%20UTC%20on%205%20October%20(right)%20in%20forecasts%20from%2027%20September.%20The%20plots%20also%20show%20areas%20as%20green%20lines%20where%20the%20values%20are%20greater%20than%200.9%20in%20the%20one-day%20EFI%20maximum%20wind%20gust%20forecast%20on%201%20October%20and%20the%20three-day%20EFI%20precipitation%20forecast%20starting%20on%202%20October.Extreme Forecast Index. Extreme Forecast Index (EFI) for 24-hour maximum wind gusts on 1 October (left) and precipitation from 00 UTC on 2 October to 00 UTC on 5 October (right) in forecasts from 27 September. The plots also show areas as green lines where the values are greater than 0.9 in the one-day EFI maximum wind gust forecast on 1 October and the three-day EFI precipitation forecast starting on 2 October.
%3Cstrong%3EPrecipitation%20observations%20and%20forecast.%3C/strong%3E%2024-hour%20accumulated%20precipitation%20up%20to%203%20October%2006%20UTC%20from%20observations%20(left)%20and%20the%20corresponding%20HRES%20run%20from%202%20October%2000%20UTC%20(right).%20The%20black%20rectangle%20shows%20the%201x1%20degree%20box%20referred%20to%20in%20the%20text.Precipitation observations and forecast. 24-hour accumulated precipitation up to 3 October 06 UTC from observations (left) and the corresponding HRES run from 2 October 00 UTC (right). The black rectangle shows the 1x1 degree box referred to in the text.
Precipitation predictions
For the extreme precipitation over southeast France and northern Italy, even the short-range forecast had problems in capturing the absolute magnitude of the event, especially in the mountains along the coast. This was also the case for the southern Alps. The average 24-hour precipitation up to 3 October 06 UTC among 79 stations (using a high-density network provided by the ECMWF Member and Co-operating States) inside a 1x1 degree box was 223 mm (but individually ranging from 22 to 615 mm). This compares with 163 mm predicted by the corresponding HRES forecast starting on 2 October 00 UTC, averaged over the corresponding grid boxes (see observations and forecast above). Comparing all forecasts in the 4 days leading up to this event, we find that HRES and ensemble (ENS) control forecasts systematically predicted more precipitation than the ensemble median. One could speculate that this is a result of model perturbations becoming asymmetric under near-saturation conditions, as it is not possible to sustain a perturbation that results in a super-saturated state.
Looking at the evolution of the forecast with decreasing lead-time, we find that the signal for this extreme rainfall event gradually became stronger, even if we see a slight jump on 29 September that coincides with the much clearer jump for the wind gust event (see the right-hand Extreme Forecast Index chart on the previous page). The extreme rainfall was due to strong advection of moisture from the Mediterranean Sea towards the southern Alps. Many analysed airmass trajectories had in fact a maximal sea passage, from Gibraltar eastwards and then on into France/Italy (see chart below). In the 6-day forecast, the atmospheric river was captured but the main flow towards the Alps was from the west instead of the south. This meant the airmass mainly passed over land instead of over sea. One could suspect that forecasting the position and shape of the trough was critical to capture this maximal sea passage, and any shift in direction would have decreased the moisture uptake.
%3Cstrong%3ESpecific%20humidity%20analysis.%3C/strong%3E%20Backward%20air%20trajectories%20ending%20off%20the%20Mediterranean%20coast%20on%202%20October%2012%20UTC%20between%20925%E2%80%93850%20hPa,%20based%20on%20ECMWF%20analyses%20and%20calculated%20with%20LAGRANTO,%20a%20software%20package%20to%20calculate%20parcel%20trajectories%20in%20the%20atmosphere%20provided%20to%20ECMWF%20by%20ETH%20Zurich.%20The%20colour%20of%20the%20trajectories%20indicates%20the%20specific%20humidity.Specific humidity analysis. Backward air trajectories ending off the Mediterranean coast on 2 October 12 UTC between 925–850 hPa, based on ECMWF analyses and calculated with LAGRANTO, a software package to calculate parcel trajectories in the atmosphere provided to ECMWF by ETH Zurich. The colour of the trajectories indicates the specific humidity.
Outlook
To summarise the predictability aspects for this event, the medium-range signal for the wind event originated from a broad-scale upper trough, while it was much more challenging to capture the rapidly developing small-scale cyclone that seems to have resulted in a sting jet. For the precipitation event, the shape of the upper-level trough is believed to have played a critical role both for the flow over the Alps and for the path the air took over the Mediterranean to pick up moisture. Important model aspects here include sea surface evaporation and other boundary layer processes as well as physical processes associated with orographic rainfall. An open question remains regarding whether this type of precipitation event over the Mediterranean can have predictability on the sub-seasonal time scale, a topic currently under research in the H2020-CAFE project.