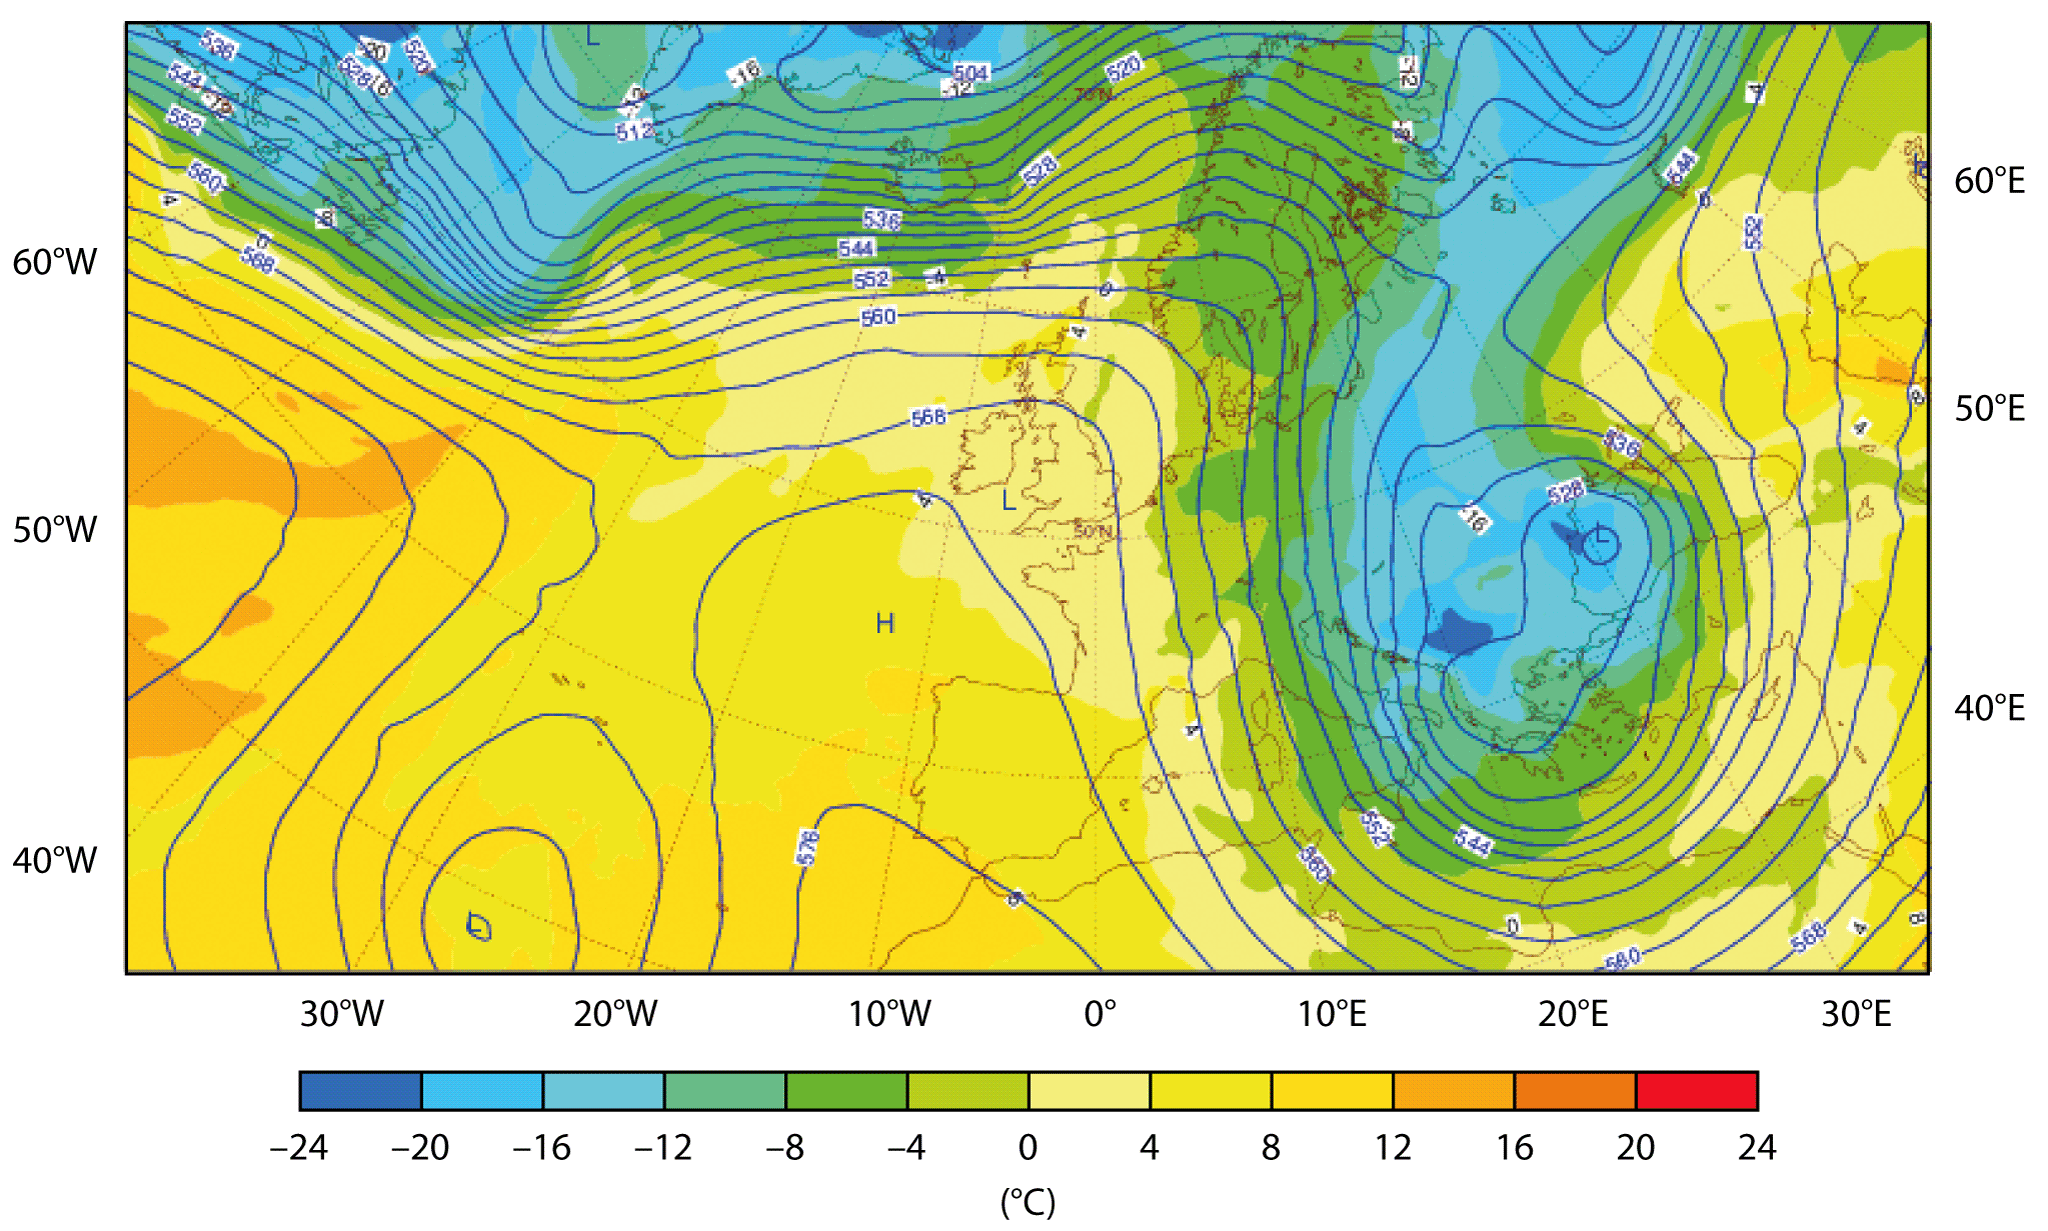
A significant part of the winter 2016/2017 was dominated by blocking conditions over Europe bringing warm air towards north-western Europe and cold air into southern Europe. For large parts of eastern Europe the second week in January was the most extreme of the winter. Russia experienced the coldest Orthodox Christmas in 120 years, and temperatures dropped to almost -30°C in Romania and the former Yugoslav Republic of Macedonia. In Sofia, Bulgaria, ECMWF’s Extreme Forecast Index (EFI) for short-range (1-day) forecasts reached -1 for three consecutive days (8–10 January). The 3-day average temperature in the city over that period was -12°C, which is 10 degrees below normal. At the same time a lot of snow fell in various parts of southern Europe, including southern Italy and Greece.
Synoptically, the wintry weather was caused by the advection of a pool of cold air from northern Russia to the southwest. This development was linked to the amplification of a ridge over the north-eastern Atlantic and of a trough downstream. Later the trough formed a cut-off low over south-eastern Europe.

Forecast quality
How well was the cold spell predicted? Focusing on the average temperature in Sofia between 8 and 10 January, no signal was present in forecasts issued before the last day of December (including monthly forecasts). During that time, the ensemble forecast distribution was close to the climate distribution. However, from 1 January (8 to 10 days before the event) all members predicted colder than normal temperatures, and from 4 January (4 to 6 days before the event) all ensemble members predicted temperatures below the 10th percentile of the model climate. The broad geographic area where cold temperatures were predicted is evident in the EFI and SOT (Shift of Tails) plots from the same date.
The short-range forecasts (1 to 3 days before the event) were clearly outside the 1st percentile of the model climate for 3-day average temperature. However, the predicted 3-day averages (around -17°C) are much lower than the observed average of -12°C. A plausible reason is that the local conditions around the observation station were influenced by the heat created in the city. A possible solution to this issue is to include an urban tile in the model, which is part of ECMWF’s long-term plans. More rural observation stations showed considerably lower temperatures at the same time (not shown).
Model climate
The cumulative distribution functions of the observed climate and the model climate (derived from re-forecasts) for midday (12 UTC) temperatures in January for Sofia are very similar in normal and warm conditions. In cold conditions, on the other hand, the model climate is colder than the observed one. The difference might be related to the urban setting of the station (as mentioned above) and/or systematic model errors. The discrepancy shows the benefit of using the model climate instead of the observed climate when calculating anomalies and points to the need for calibration under certain circumstances. It is worth noting that in other locations the opposite difference can be seen: the model is too warm in cold conditions during winter, especially in rural regions in northern Europe.
To summarise, the extended-range forecasts failed to predict the cold period in the second week of January in eastern Europe, while it was well captured in medium-range forecasts. In short-range forecasts the predicted temperatures were too low, probably because they failed to take into account local conditions, pointing to the need for post-processing.

