New diagnostic parameters and wave output fields have been made available in ecCharts, a web-based application providing easy access to ECMWF's medium-range forecasts in a graphical format and in their native resolution. The rich web user interface of ecCharts offers an interactive set of tools to display and explore the meteorological situation in far greater detail than is possible using standard web charts provided on ECMWF’s website. It provides an extensive range of parameters and products (currently around 230 layers) from ECMWF’s high-resolution and ensemble forecasts (HRES and ENS), which users can combine to create their own products.
ecCharts is updated twice a year, in June and November. These updates introduce new layers and features compiled by ECMWF based on internal developments and user feedback collected from various channels, including ecCharts help pages, workshops, meetings and Member State visits.
The latest update of ecCharts was implemented at the end of November 2016 and coincided with the operational testing period of a new version of ECMWF’s Integrated Forecasting System (IFS Cycle 43r1). Between early October and the implementation of the IFS upgrade on 22 November, all ecCharts layers were duplicated to present graphical products from the new IFS cycle together with operational data. This facility provided a convenient way of monitoring the new IFS version’s performance compared to the operational version in real time.

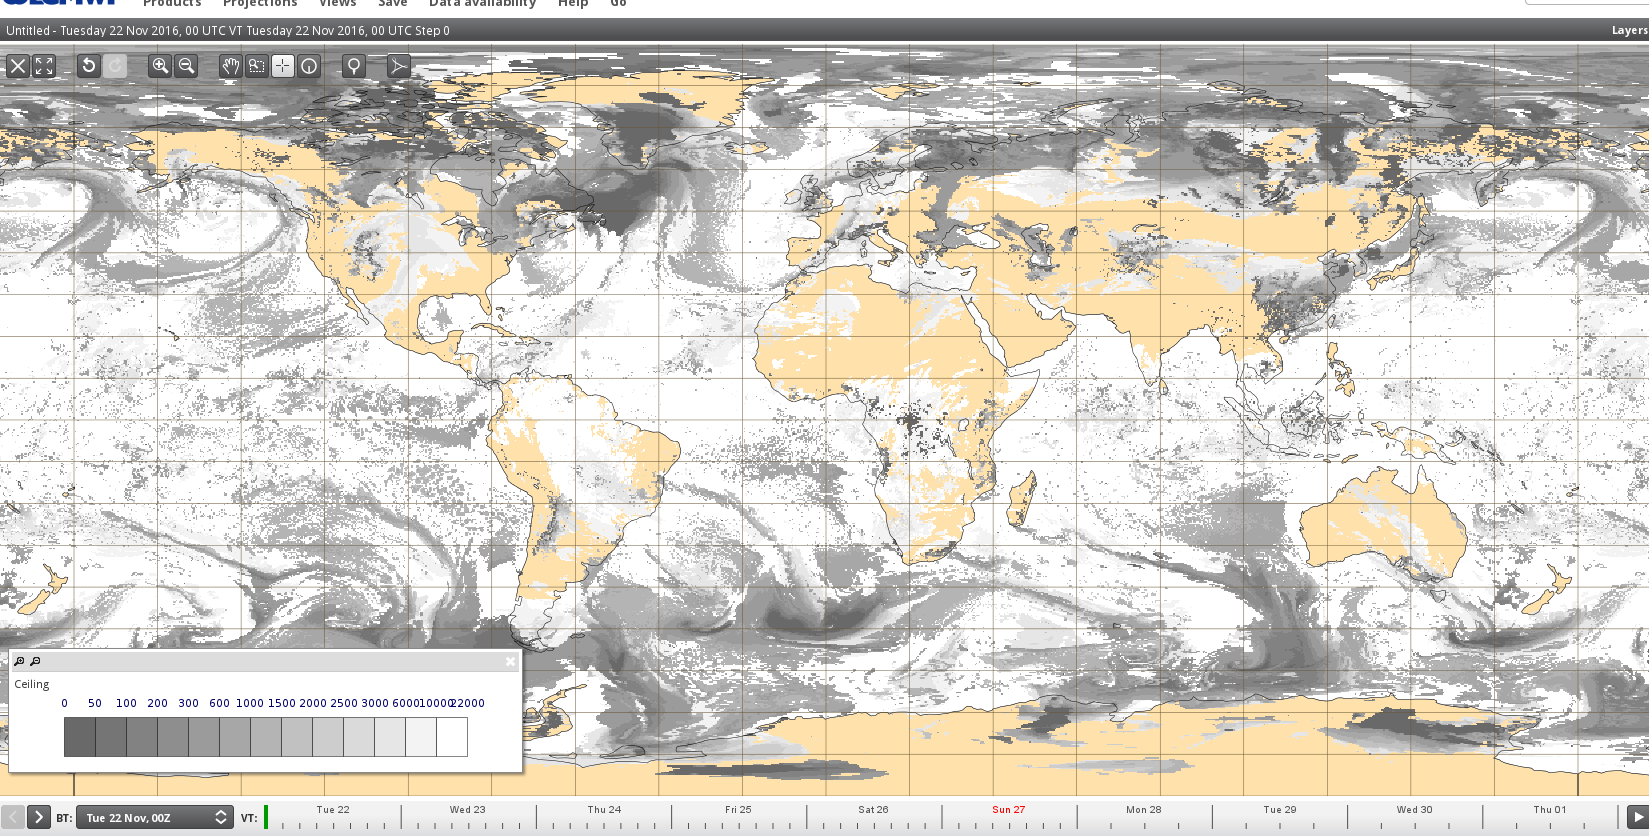
In addition to providing existing ecCharts layers for the new IFS version, users are now also able to visualise some of the new parameters introduced by IFS Cycle 43r1. Those parameters include cloud and freezing level layers and eight new wave model layers, including the magnitude and direction of the wave energy flux that is responsible for the impact of waves on coastlines and offshore structures.
Other HRES parameters made available in the ecCharts update include cloud base height, total column water and water vapour and potential vorticity at various pressure levels.

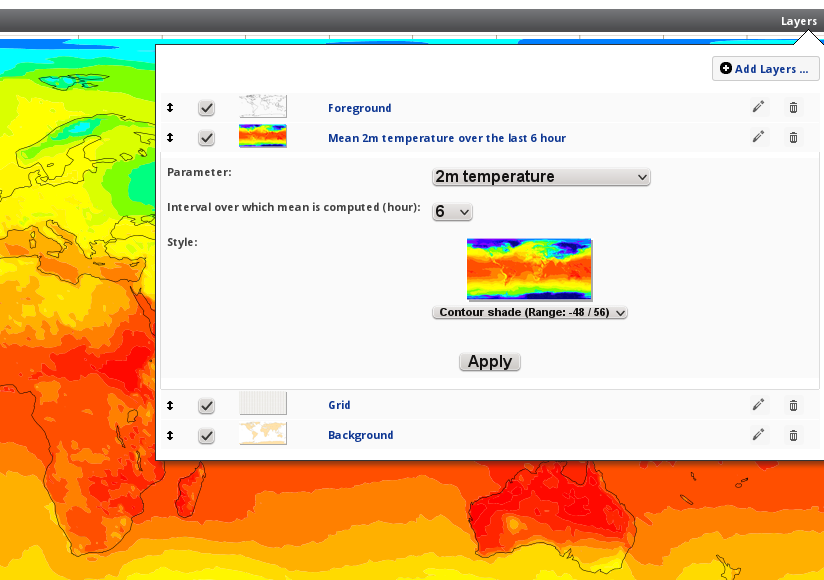
One of the new layers enables users to compute and plot 2 m mean temperature over a user-controlled interval up to a selected forecast valid time. The interface enables users to choose one of the 2 m temperature parameters (instantaneous, minimum and maximum 2 m temperature) and the interval over which the mean is computed.

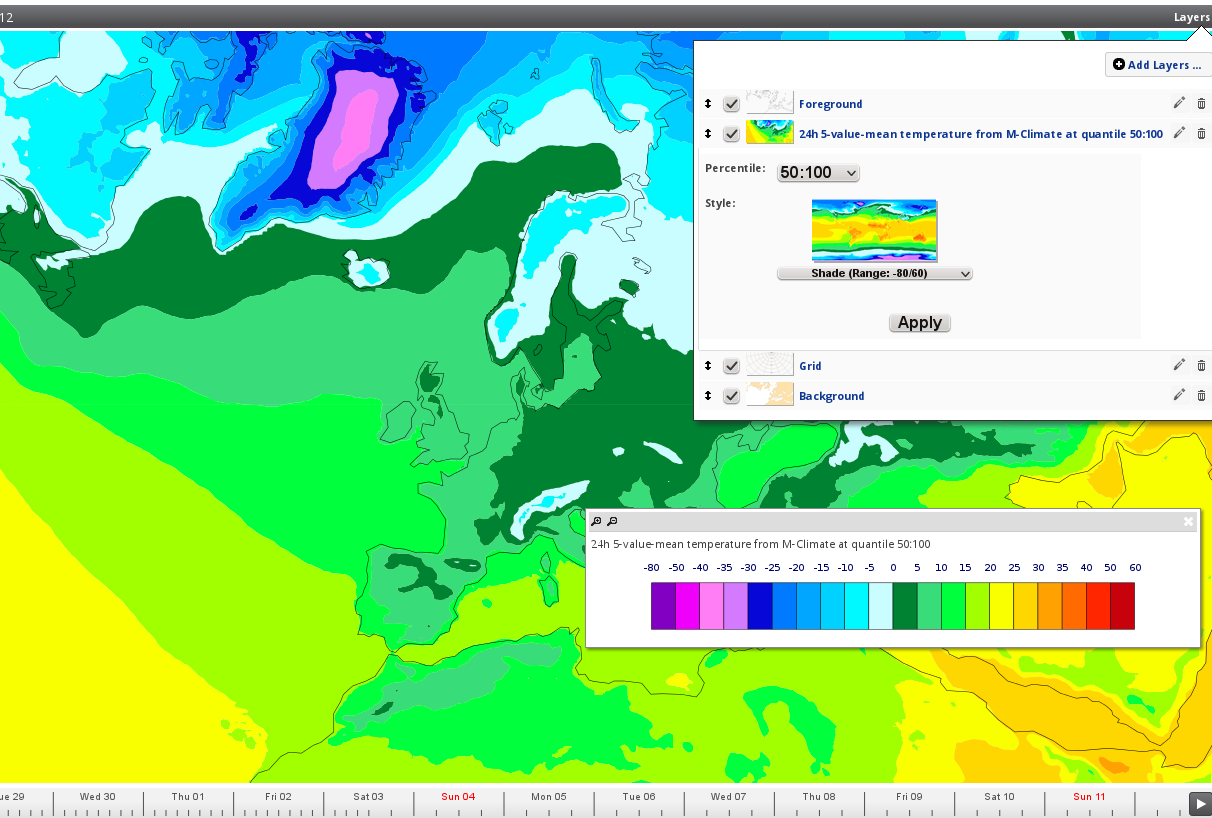
Another major addition is the introduction of model climate (M-Climate) parameters. The model climate is the reference climate that is used to compute severe weather parameters, such as the Extreme Forecast Index (EFI). The model climate is based on five weeks of re-forecasts using an 11-member ensemble over the last 20 years (in total 1980 realisations). It is produced twice a week. The model climate always uses the same IFS version as ENS. There are several M-Climate layers in ecCharts (the same parameter set as in the EFI) offered at pre-defined percentiles. Users can customise the chart by editing and selecting a percentile (available percentiles are 0, 1, 10, 25, 50, 75, 90, 99 and 100%) as well as applying different contouring options.
M-Climate parameters are produced as ‘daily’ values twice a week (on Mondays and Thursdays). In ecCharts, they are provided for all forecast runs and all time steps of a standard ENS field (3-hourly up to day 6 and 6-hourly up to day 15) to make it possible to overlay M-Climate fields with daily forecast fields.
The update also contains two additional parameters (2 m minimum and maximum temperature) available as Cumulative Distribution Function (CDF) plots for a selected position, complementing 2 m mean temperature CDF plots. They are available through Meteogram view in the ecCharts interface.
Most ecCharts layers are also available through Web Map Service (WMS). WMS is a standard protocol for serving georeferenced map images. The ecCharts WMS service enables user applications to request georeferenced maps from ecCharts layers. Since March 2017, it has been possible to make requests in Web Mercator projection (in addition to standard projection), which is commonly used by applications such as Google Maps.
All ENS layers in ecCharts are available 40 minutes earlier since 8 March thanks to the change in ECMWF’s dissemination schedule implemented that day.
More detailed explanations of the latest ecCharts update (including previous updates) can be found at https://software.ecmwf.int/wiki/display/ECCHARTS/Updates.
To find out more about ecCharts or make a request, please visit https://software.ecmwf.int/wiki/display/ECCHARTS.

